 TRADING FOUNDRY
Why Risk Comes First.
Explain why a fixed, small risk per trade matters more than any entry technique, and choose a sensible risk percentage for your own account.
Most trading education starts with entries: where to buy, where to sell, which pattern to look for. It is the exciting part, so it gets the attention. This course starts somewhere less glamorous and far more important — with the question of how much you lose when you are wrong.
Here is the uncomfortable truth that sits under every strategy you will ever learn. Two traders can take exactly the same trades, at exactly the same prices, with exactly the same stops and targets — and one of them can grow an account while the other blows it up. The only difference between them is size. Entries decide whether a trade wins. Risk management decides whether you are still trading next month.
By the end of this lesson you will understand why professional traders obsess over a single number — their risk per trade — and you will have chosen your own.
Two traders, one trade
Look at the first chart. It is a perfectly reasonable long trade on EUR/USD: an uptrend, a pullback, a buy near the pullback low, a stop below structure. It loses. That is not a disaster. Good setups lose all the time; that is what a probability is.
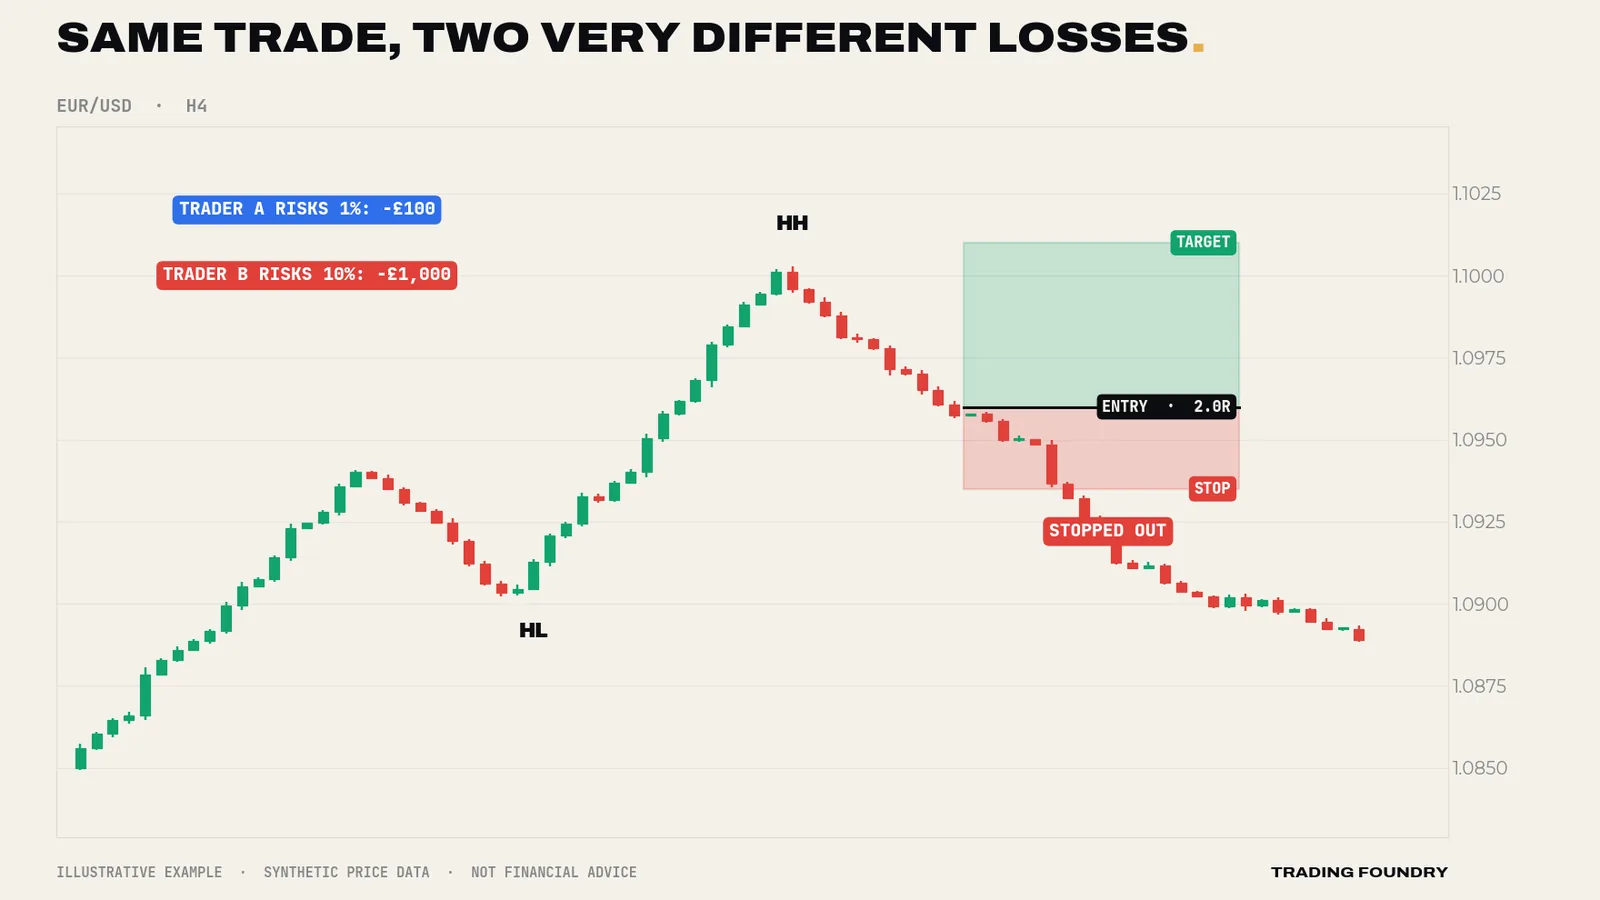
Trader A loses £100. Annoying, forgettable, and fully recoverable on the next decent trade. Trader B loses £1,000 — a tenth of the account in a single afternoon, on a trade that was correctly analysed. Nothing about Trader B's chart reading was worse. The size was the mistake.
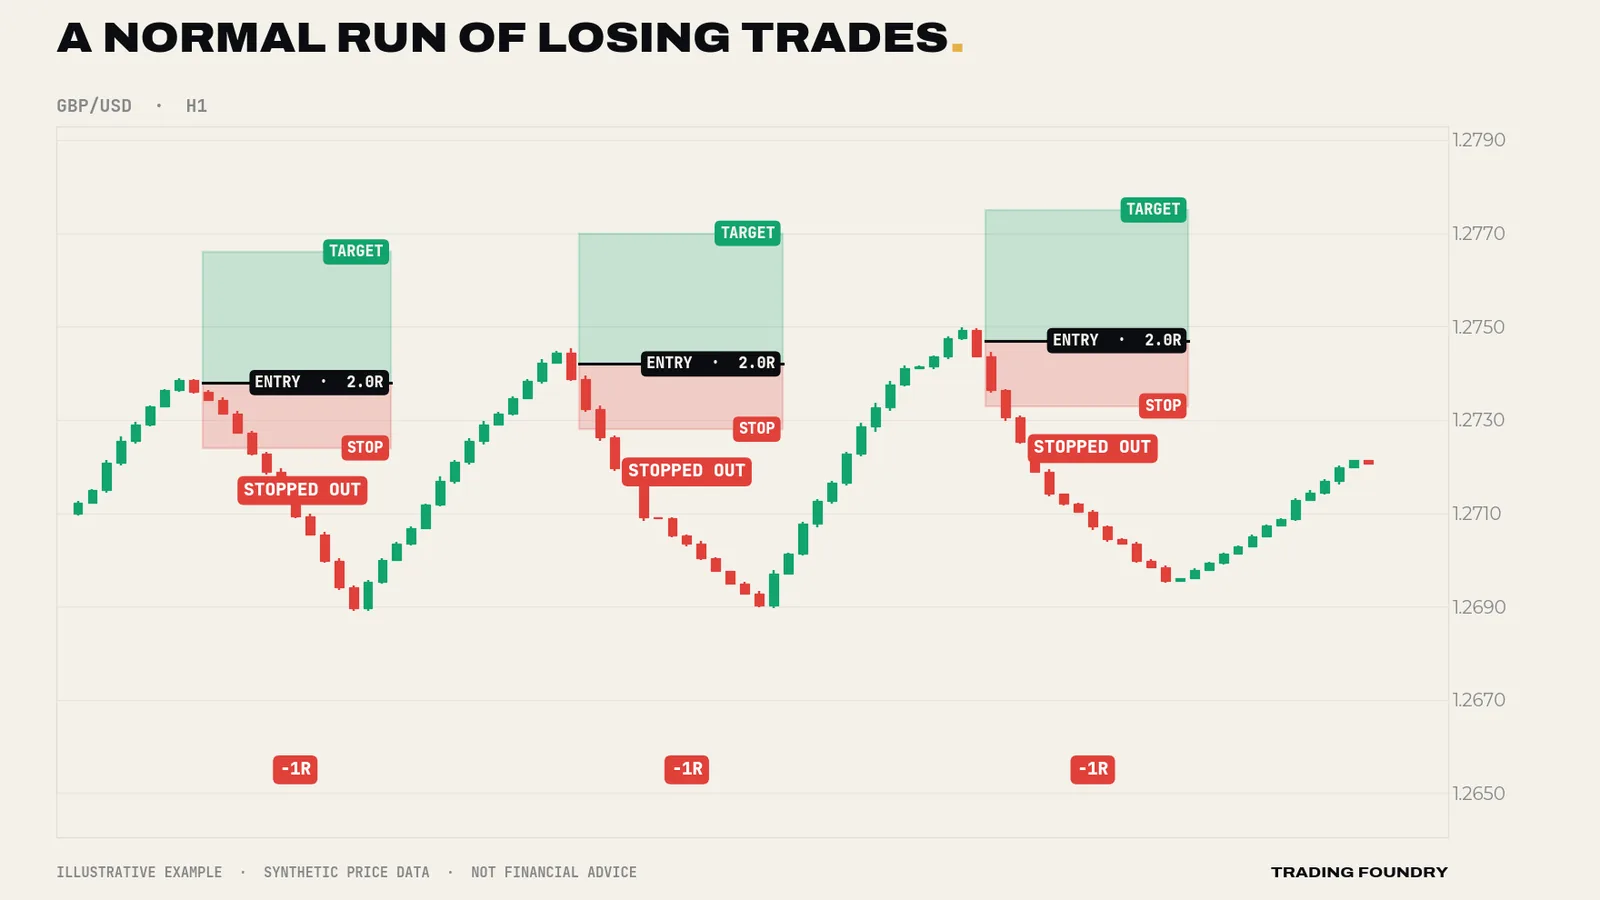
Now stretch that across a normal run of trading. Every method, however good, produces strings of consecutive losses. Not occasionally — routinely. Lesson 5 shows the probabilities in detail; for now, accept that a run of five, six or seven losses in a row is something any trader with a realistic method will experience, probably more than once a year.
What a losing streak does to each account
This is the table that should change how you think about size. It shows what happens to an account after a run of losing trades at different fixed risk levels, with each loss taken as a percentage of the current balance.
| Risk per trade | After 5 losses in a row | After 10 losses in a row |
|---|---|---|
| 0.5% | −2.5% | −4.9% |
| 1% | −4.9% | −9.6% |
| 2% | −9.6% | −18.3% |
| 5% | −22.6% | −40.1% |
| 10% | −41.0% | −65.1% |
At 1%, ten straight losses — a genuinely bad run — leaves you down under 10%. You are bruised, but you still have more than nine-tenths of your capital and every option open. At 5%, the same run takes away 40% of the account. At 10%, two-thirds of it is gone, and as lesson 6 shows, you would then need to triple what is left just to get back to where you started.
The losing streak is not a risk you can avoid. It is coming whatever risk you choose. The only thing you choose is how deep the hole is when it arrives.
Ruin is the only outcome you cannot recover from
Every other bad outcome in trading is temporary. A losing week ends. A drawdown can be climbed out of. A strategy that stops working can be replaced. But an account that has been destroyed — or shrunk so far that recovery needs heroic returns — takes away the one thing every edge needs to work: time and repetitions.
This is the core idea of the whole course. An edge is a long-run advantage. It only shows up over many trades — dozens at minimum, hundreds to be confident. If your size is so large that a normal losing streak knocks you out before those trades happen, the edge never gets the chance to appear. You were right about the market and still lost the money.
So the first job of risk management is not to make money. It is to make sure you are still here for the trades that do.
Why a percentage, and why 0.5–1%
The standard approach — and the one this course uses throughout — is to risk a fixed percentage of your current account balance on every trade. Not a fixed amount of money, not "whatever feels right", and not more when you feel confident.
A percentage does two useful things automatically:
- It shrinks your size when you are losing. After a drawdown, 1% of a smaller balance is a smaller sum of money, so the hole digs itself more slowly.
- It grows your size when you are winning. As the balance rises, 1% becomes a larger sum, so gains compound without you having to decide to "size up".
Why 0.5–1% as an illustration? Because at that level, the worst losing runs a realistic method throws at you leave the account dented rather than broken, and because it leaves room for the other limits we will build later — daily caps, correlation caps and prop-firm drawdown rules all assume a small base risk. Many experienced traders sit at 0.25–0.5%. Very few who last a long time sit much above 2%.
Treat those numbers as illustrative, not as a prescription. The right number for you depends on your method's losing streaks, your account size, your psychology and any external rules (such as a prop firm's). But if you are new, start at the low end. You can always increase risk once you have a journal full of evidence. You cannot un-blow an account.
Risk is measured to the stop
One more definition, because everything later depends on it. Your risk on a trade is the money you lose if your stop is hit. It is not your margin. It is not the size of your position. It is not your leverage. A huge position with a tight stop can risk less than a small position with a wide stop.
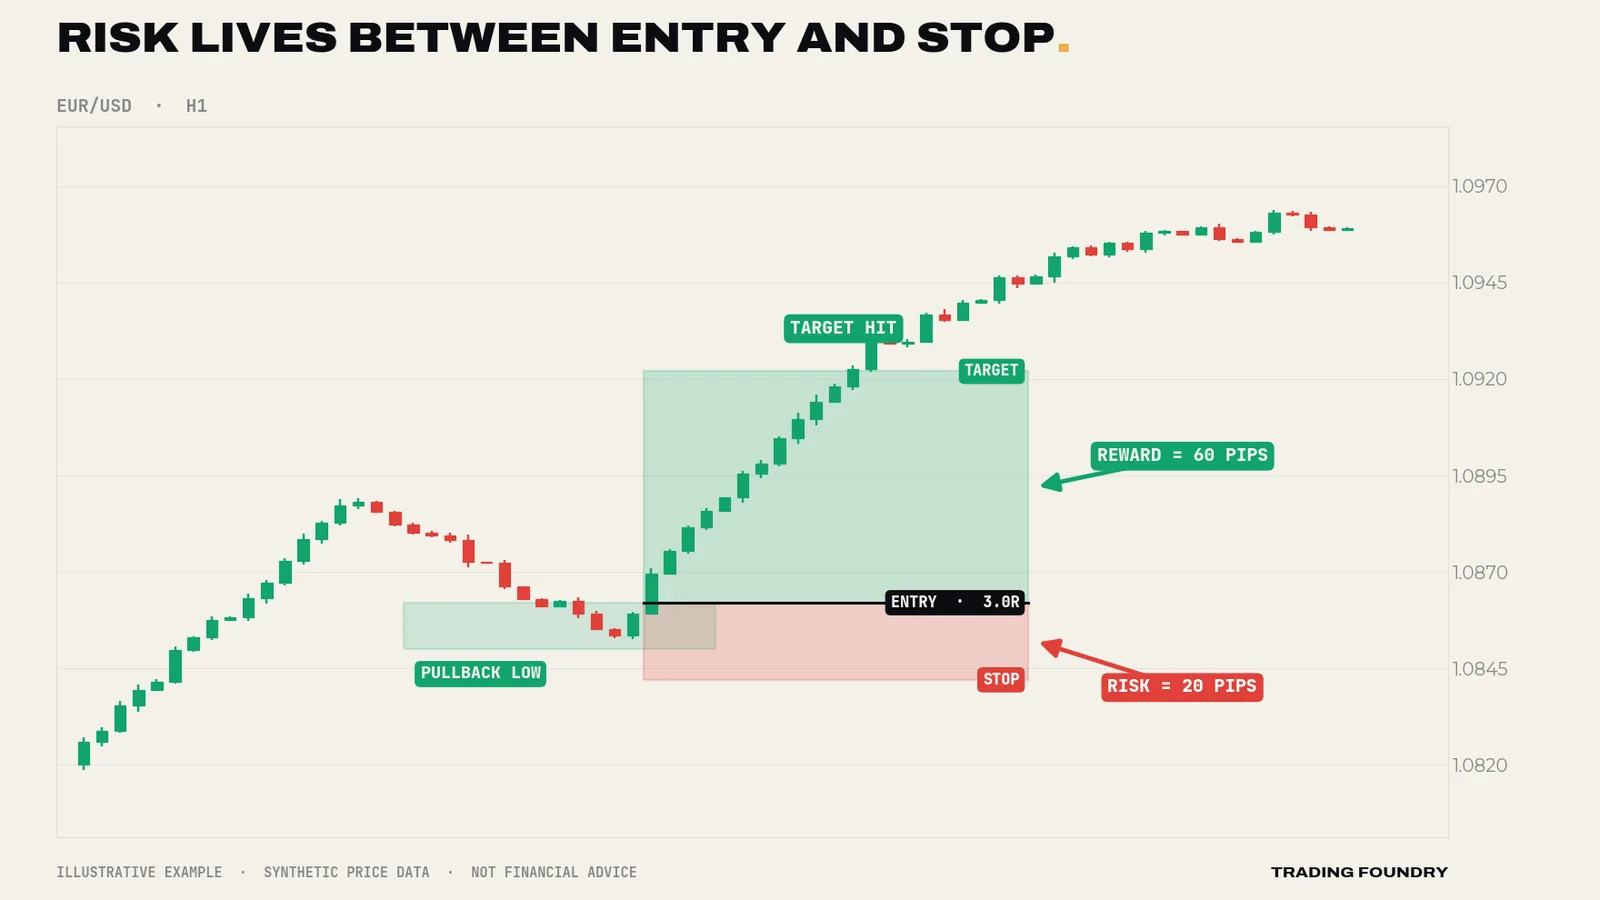
That is why the order of operations matters so much, and why lesson 2 is built around it:
- Find the trade and decide where the idea is wrong — that is your stop.
- Measure the distance from entry to stop.
- Calculate the position size that makes that distance cost exactly your chosen percentage.
The stop is decided by the chart. The size is decided by the maths. Your feelings decide neither.
Going deeper
Risk of ruin is not linear. Doubling your risk per trade does not double your chance of disaster — it multiplies it. Because losses compound against a shrinking balance, and because the recovery needed after a drawdown grows faster than the drawdown itself, there is a point beyond which even a method with a genuine edge has a meaningful chance of falling into a hole it cannot climb out of. For realistic retail methods (modest edges, win rates somewhere between 35% and 55%), that cliff starts to appear somewhere in the 3–5% per trade range. Under about 1%, it is remote for any method that has a real edge at all.
Stops are not guarantees. A stop order becomes a market order when it is touched. In fast markets — major data releases, weekend gaps, thin liquidity — your fill can be worse than your stop price. A trade sized to lose 1% can lose 1.3% or more.
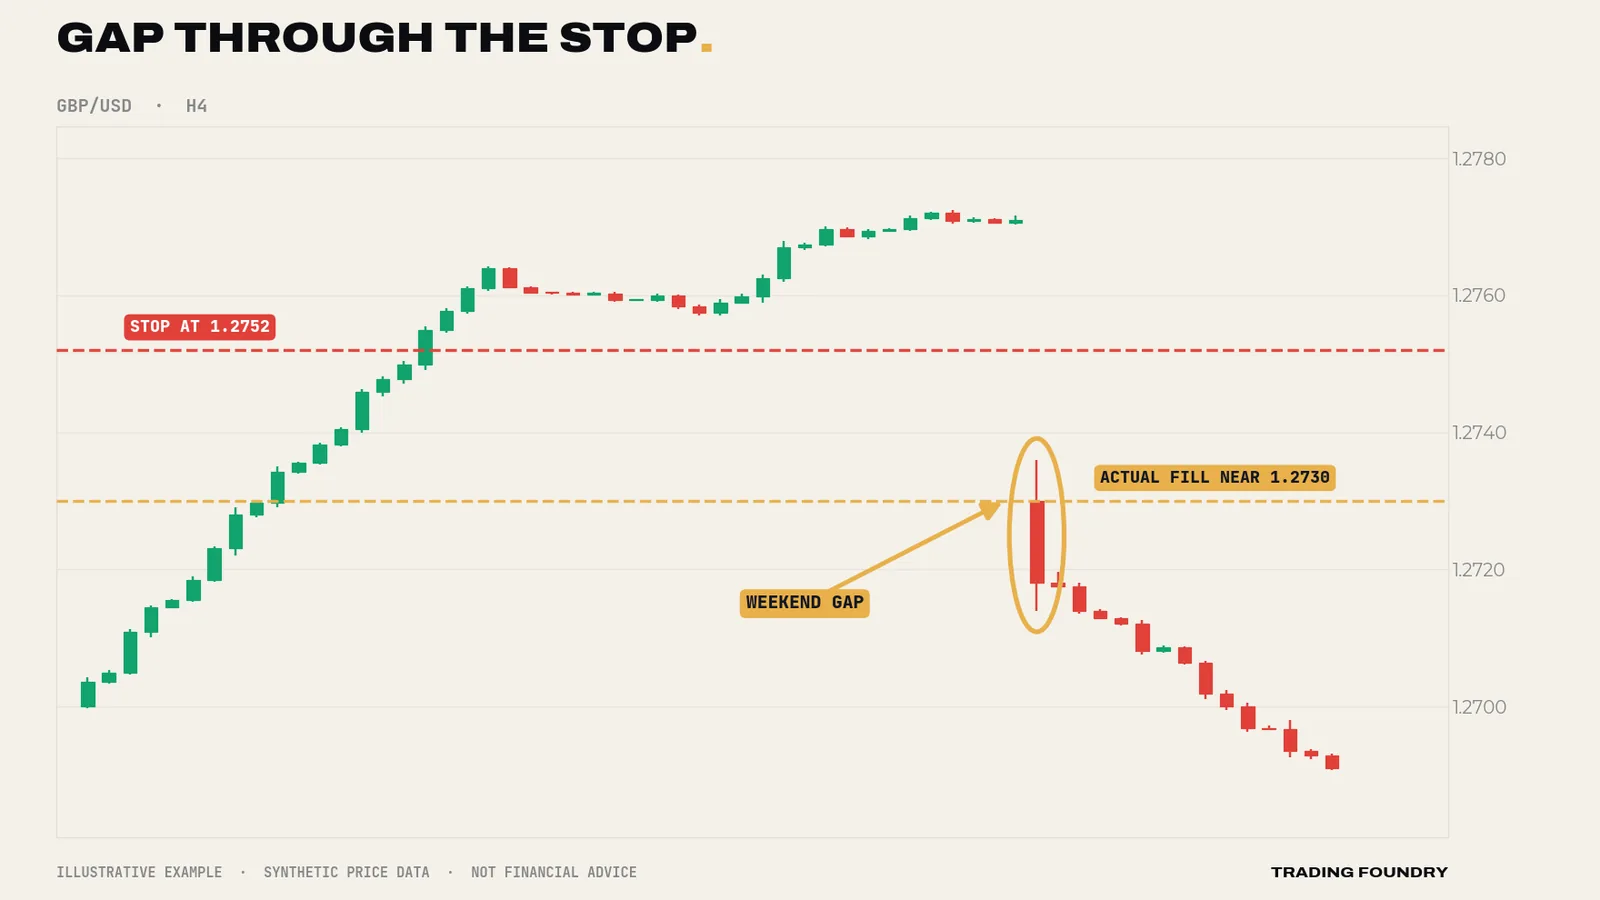
This is another argument for small risk. At 1%, an ugly gap turns a 1% loss into a 2% one. At 5%, it can turn into 10%. Keeping base risk low gives you headroom for the events your stop cannot protect you from, and it is why later lessons treat high-impact news and weekend holding as risk decisions, not just trading decisions.
Fixed fractional versus fixed amount. Some traders prefer to risk a fixed sum — say £100 — and only recalculate it monthly. That is fine as long as the sum is reset downwards promptly in a drawdown. Risking a fixed amount that was set when the account was larger is a quiet way of creeping up to 2% or 3% while telling yourself you are still at 1%.
- Every trade has a stop decided before entry, and risk is measured to that stop.
- Risk a fixed percentage of current balance per trade (illustratively 0.5–1%), the same on every trade.
- Never raise risk because you feel confident, or to win back a loss.
- If you are new, start at the low end of your range and raise it only on evidence from your journal.
Summary
- Entries decide whether a trade wins; size decides whether you survive the losing ones.
- Losing streaks are guaranteed. At 1% risk, ten losses cost under 10%; at 10% risk they cost about two-thirds of the account.
- Risk a fixed percentage of current balance — 0.5–1% is a sensible illustrative range — so size shrinks in drawdowns and grows with the account.
- Risk is the money lost if the stop is hit: the distance from entry to stop, multiplied by your position size.
- Stops are not guarantees, so small base risk leaves headroom for gaps and slippage.
Quick quiz.
Education only, not financial advice. Charts are illustrative training examples using synthetic price data, not real market history or results.