 TRADING FOUNDRY
What RSI Actually Measures.
Explain exactly how RSI is calculated, read any reading as a statement about recent momentum, and stop treating the number as a verdict on price.
Almost every forex chart you will ever see has an RSI panel underneath it. Ask the trader who put it there what the line measures and the usual answer is "whether the market is overbought or oversold". That answer is incomplete at best, and it is the root of most of the money lost with this indicator.
This course is about one tool, used properly. Before we touch divergence, regimes or entries, we need to know what the number on the screen actually is — because every rule later in the course is built on it. If you understand the arithmetic, you will never again be surprised that RSI "stayed overbought" for two weeks, and you will see divergence for what it really is: a measurement, not a prophecy.
The calculation, without the mystique
The Relative Strength Index was published by J. Welles Wilder in 1978, in the same book that gave us the Average True Range. Wilder was an engineer, and RSI is an engineer's tool: a way of compressing recent momentum into a single number that always sits between 0 and 100.
Here is the whole calculation:
- Look at the last 14 candles (14 is Wilder's default and the one this course uses).
- For each candle, compare its close with the previous close. If it closed higher, record the gain. If it closed lower, record the loss as a positive number.
- Average the gains. Average the losses.
- Divide average gain by average loss. That ratio is the "relative strength", RS.
- Convert it to a 0–100 scale: RSI = 100 − 100 ÷ (1 + RS).
That is the entire indicator. No volume, no sentiment, no order flow. Just the size of recent up-closes compared with the size of recent down-closes.
Three worked numbers make it concrete. Suppose that over the window the average up-close was 12 pips and the average down-close was 4 pips. RS is 3, and RSI is 100 − 100 ÷ 4 = 75. Now suppose up-closes and down-closes averaged 6 pips each. RS is 1, and RSI is exactly 50. Finally, average up-close 4 pips, average down-close 12 pips: RS is a third, RSI is 25.
Speed, not distance
Notice what that question does not ask. It does not ask how far price has travelled. It asks how one-sided the travel was. A market that rises 120 pips in eight clean candles produces almost no down-closes, so average loss is tiny and RSI shoots towards 90. A market that rises the same distance over thirty candles of two-steps-forward, one-step-back produces plenty of down-closes along the way, and RSI might sit in the 60s or low 70s the whole time.
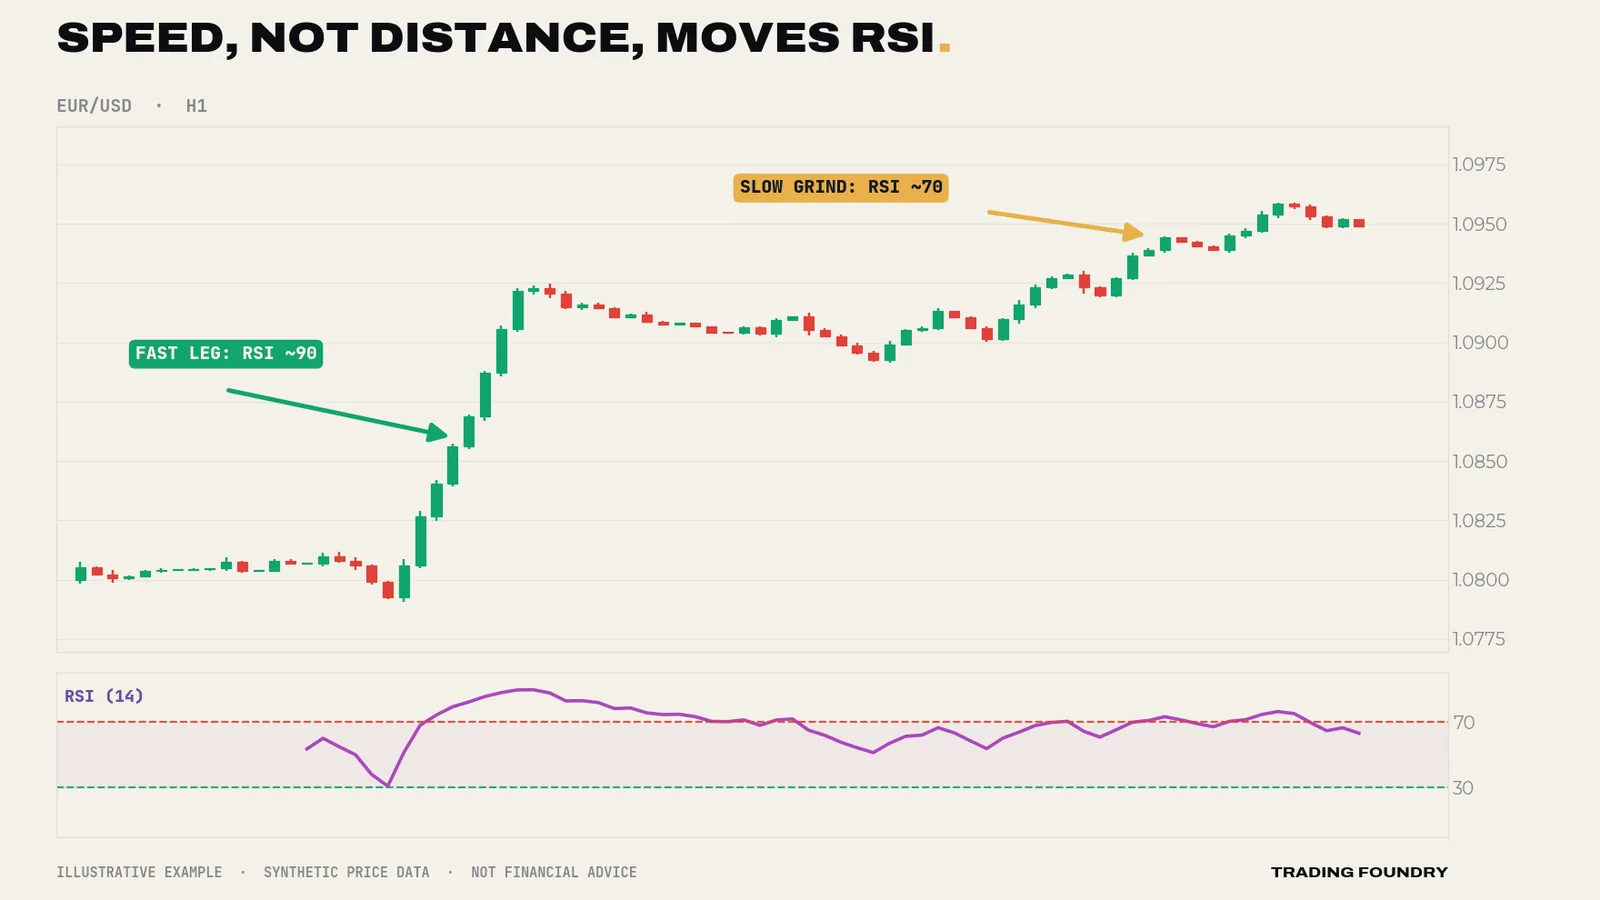
This is the single most important idea in the course. RSI is a speedometer, not a map. It tells you how hard the market has been pushing recently, not where price is. That is why the bounded scale is so useful: an RSI of 75 means the same thing on EUR/USD H1 in 2016 as on gold daily today. You can compare this swing's thrust with the last swing's thrust on the same ruler, which is all divergence trading really is.
What a reading of 50, 70 or 30 actually says
Translate the maths into plain English and the readings become very ordinary:
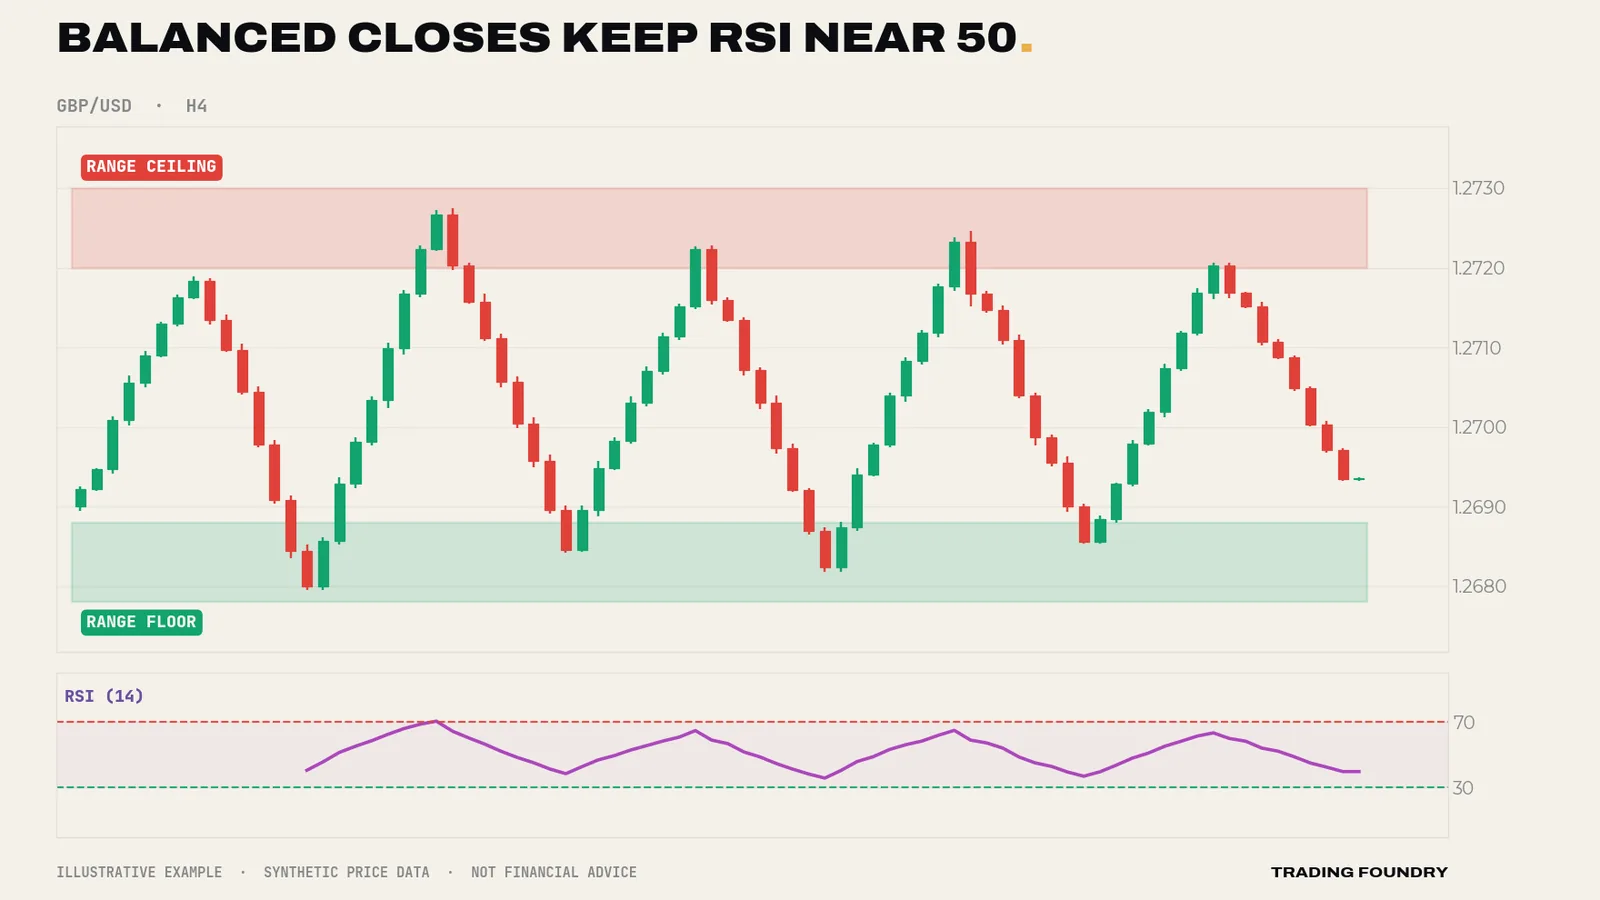
- RSI 50 — up-closes and down-closes have been the same size. Momentum is balanced.
- RSI 70 — recent up-closes have been more than twice the size of recent down-closes (RS is 2.33).
- RSI 30 — the mirror: down-closes have been more than twice the size of up-closes.
None of those statements says price is "too high", that buyers are exhausted, or that a reversal is due. An RSI of 70 says only that the market has been going up hard relative to how it has been going down. Hold on to that sentence; Lesson 2 is built on it, because "going up hard" is also a perfectly good description of a healthy uptrend.
Wilder's smoothing: RSI has a memory
One wrinkle matters in practice. Wilder did not use a plain 14-bar average. After the first value, each new average is built like this:
new average gain = (previous average gain × 13 + today's gain) ÷ 14
and the same for losses. This behaves like a long exponential average. Each new candle nudges the averages rather than replacing them, so old data fades out gradually instead of dropping off a cliff after 14 bars.
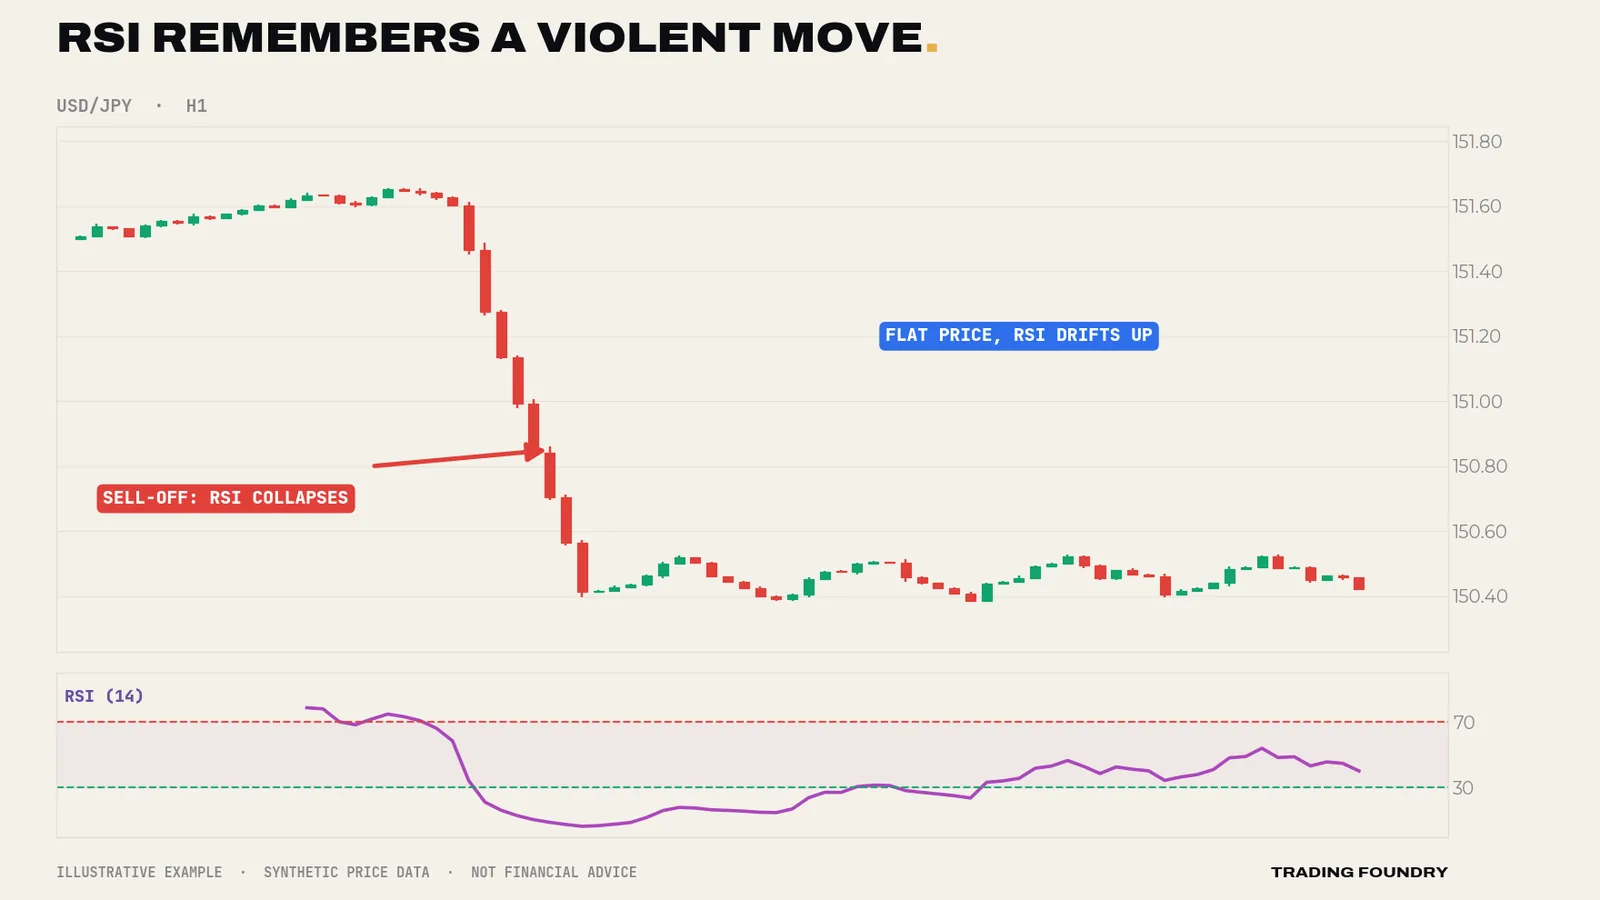
Two consequences follow. First, RSI moves more smoothly than price — one big candle shifts it, but does not reset it. Second, after a violent move, RSI takes time to "forget". A sharp sell-off followed by sideways drift leaves RSI climbing slowly back towards 50 over many candles, even though price is going nowhere. That recovery is the averages decaying, not buyers arriving.
RSI is not a leading indicator
You will hear oscillators sold as "leading" indicators, in contrast to "lagging" moving averages. That is marketing. RSI is calculated entirely from past closes. It cannot contain information about the future, and it turns when price turns, not before.
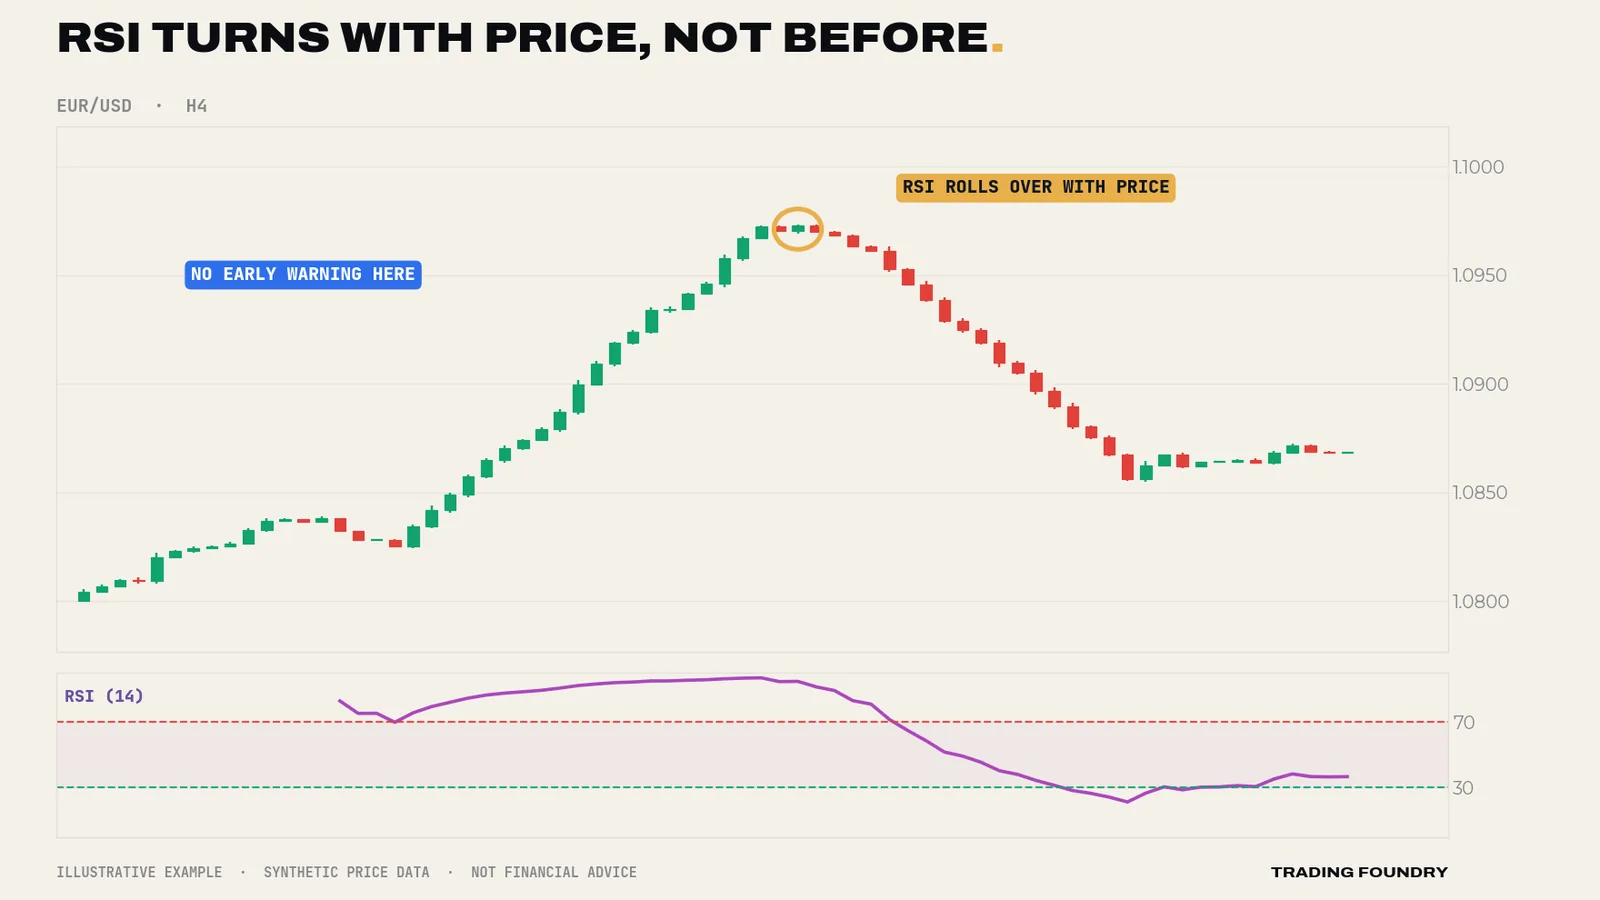
So what is the honest case for keeping it on your chart? It describes the present more precisely than your eyes can. Momentum fading beneath a rising price is hard to see on candles and easy to see on RSI. Not a crystal ball — a better pair of glasses. Every technique in this course is a way of using those glasses well.
Settings: leave them alone
You can change the lookback. A 7-period RSI is twitchy and visits the extremes constantly. A 21-period RSI is stately and rarely leaves the middle. Shorter settings give more signals of lower quality; longer settings give fewer signals with more lag. There is no magic number.
Our position is simple: stay on 14. Not because 14 is provably optimal — nobody can prove that — but because fiddling with settings is what traders do instead of fixing their process. A divergence that only appears on RSI(9) and vanishes on RSI(14) is a fragile signal. A concept that genuinely works should work on the default.
Going deeper
Why the scale is bounded. As RS heads towards infinity (no down-closes at all) RSI approaches 100 but never reaches it; as RS approaches zero, RSI approaches 0. The formula compresses the extremes: moving RS from 1 to 2 lifts RSI from 50 to 66.7, but moving it from 4 to 8 only lifts it from 80 to 88.9. Practically, the difference between RSI 85 and 90 represents a much bigger change in the underlying ratio than the difference between 50 and 55. Do not read the scale as linear at the edges.
The seed problem. Wilder's first value is a simple average of the first 14 periods; everything after is smoothed from it. Because the smoothing has a long memory, two platforms that start their calculation from different amounts of history can show slightly different RSI values for the same candle — usually a point or two. That matters if your rules contain sharp thresholds such as "below 40.0". Treat RSI levels as zones (40–50, not 40.0) and you will be immune to it.
Closes only. RSI ignores highs and lows entirely. A long-wicked candle that closes unchanged contributes nothing. That is why a pin bar can reject a level violently while RSI barely moves, and why some divergences look "wrong" if you draw price swings on wicks. We will return to this in Lesson 4: be consistent about whether you draw on closes or wicks.
Timeframe is part of the reading. "RSI is 68" is meaningless without "on which chart". The H1 RSI describes roughly the last day of trading; the daily RSI describes nearly three weeks. In Lesson 9 we give each timeframe a fixed job so the different readings stop arguing with each other.
- RSI measures the size of recent up-closes relative to recent down-closes — nothing else.
- Read RSI levels as zones, never as exact thresholds.
- Use the default 14-period setting unless your own documented testing gives you a reason to change.
- Always state the timeframe when you quote an RSI reading.
Summary
- RSI is a smoothed ratio of average up-closes to average down-closes, rescaled to 0–100.
- It measures the speed and one-sidedness of recent movement, not distance and not "value".
- 50 means balance; 70 means up-closes have been more than twice the size of down-closes; neither predicts a reversal.
- Wilder's smoothing gives RSI a memory, so it recovers gradually after violent moves.
- RSI is not leading. Its edge is describing momentum more precisely than your eyes can.
Quick quiz.
Education only, not financial advice. Charts are illustrative training examples using synthetic price data, not real market history or results.