 TRADING FOUNDRY
Price First, Framework Second.
Separate what a chart observably shows from what the Smart Money framework calls it, so you can use SMC as a precise vocabulary without buying the folklore.
Smart Money Concepts is the most popular trading framework of the last decade, and the most mythologised. Open any social feed and someone is explaining that "the banks" ran your stop, that "the algorithm" must return to a gap, that a candle you have never noticed is secretly where a fund loaded its position. Some of those people are good chart readers. Almost none of them can show you the order flow they are describing.
This course teaches SMC properly — structure, liquidity, sweeps, fair value gaps, order blocks, breakers, premium and discount, top-down timing and a complete rule-based strategy. But it teaches it with one discipline running underneath every lesson, and it is the line you will see again and again:
Price first. Framework second.
You describe what price did, in plain words that anyone could check on the chart. Only then do you apply the framework's label. If the label does not survive that order of operations, you do not use it.
What the framework actually claims
Strip away the thumbnails and SMC makes a simple argument. Large participants — banks, funds, dealers — cannot buy or sell size the way you can. A fund wanting to buy two billion euros cannot click once without moving the price against itself. So, the model says, large orders get filled where there is plenty of opposing business to trade against — and the densest opposing business sits where other traders' stop-losses and pending orders cluster: above old highs, below old lows, beyond equal highs and lows, around session extremes. Price is therefore drawn toward those clusters. When the large player is filled, price leaves quickly, and the chart is left with footprints the framework gives names to: order blocks, imbalances, breaks of structure.
That argument has three layers, and you need to know which is which.
- Verifiable. Stop orders do cluster at obvious levels, because people are taught to put them there. Large orders are worked carefully to limit market impact. Price does frequently push beyond an obvious high or low and then reverse.
- Plausible. Some sharp reversals after an old low is taken out may reflect a large buyer using that burst of forced selling to fill.
- Narrative. A coordinated "smart money" entity hunting your specific stop, or a market-making algorithm that must deliver price to a level. Nobody teaching this on the internet has an audited view of institutional order flow. Neither does this course.
One chart, two descriptions
Here is the habit the whole course is built on. Look at the chart below and describe it twice.
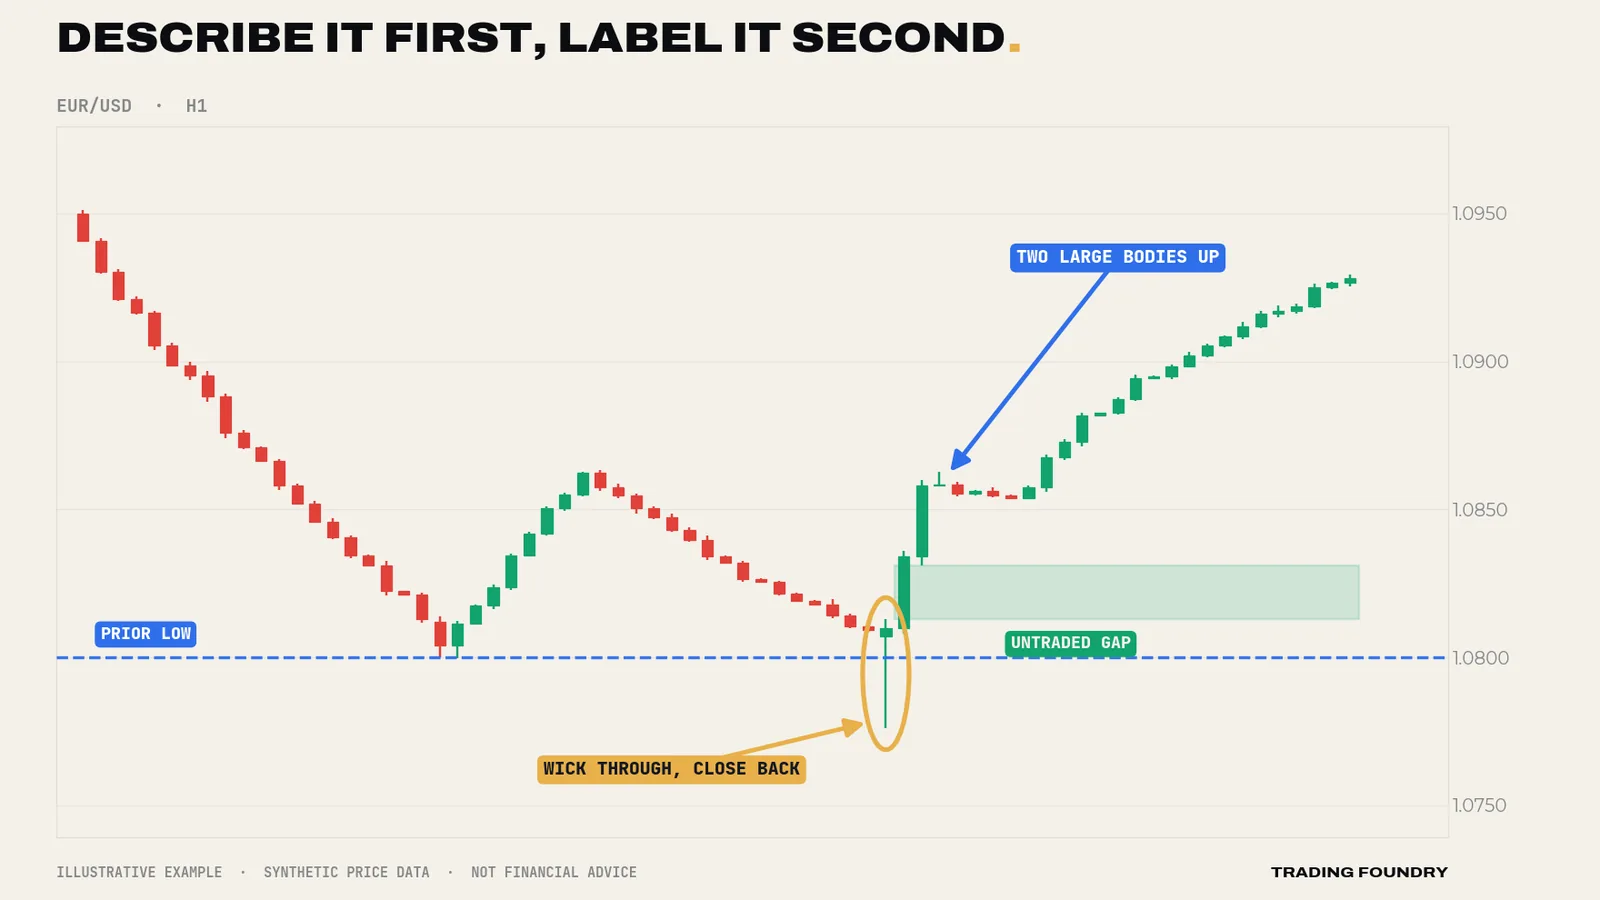
The price-first description: price traded 24 pips below the prior low, closed back above that low on the same candle, then rose 50 pips in two candles with large bodies and small wicks, leaving a band of prices between the sweep candle's high and the third candle's low where no trading took place.
The framework description: sell-side liquidity was swept, smart money accumulated longs, displacement followed and left a bullish fair value gap.
The first description could be checked by a stranger with a ruler. The second adds a motive — accumulation by smart money — that nobody can see. Both descriptions point to the same tradeable fact: an obvious low failed to hold on a closing basis and buyers responded hard. That fact is what you trade. The motive is decoration.
Why a model can be useful without being literally true
None of this is a demolition job. A model does not need to describe reality literally to be useful; it needs to organise what you see and generate expectations you can test. Newtonian mechanics is "wrong" at the edges and still lands aircraft.
SMC's core observations are about price behaviour, and price behaviour you can verify candle by candle:
- price frequently probes beyond obvious levels before reversing;
- strong moves often retrace towards the area that launched them;
- trends tend to announce their end by breaking structure;
- fast one-directional moves leave gaps that are often partly revisited.
None of those needs a story about Barclays' flow desk. They are observations about where orders are likely to be and how crowds behave around obvious prices.
The danger is the causal story. A trader who believes the banks are hunting stops stops testing and starts believing. Losing trades become "manipulation" instead of data. The model becomes impossible to disprove — and a model that cannot be disproved is astrology with candlesticks.
The vocabulary, with its older names
Almost every SMC idea existed before SMC named it. That is not a criticism; it is useful, because it means decades of classical analysis apply to these concepts too.
| SMC term | What you can see | Classical name |
|---|---|---|
| Liquidity pool | An obvious high or low where stops are likely to sit | Support / resistance with stops beyond |
| Liquidity sweep | Price trades through a level and closes back inside | False breakout, bull/bear trap, Wyckoff spring |
| Break of structure (BOS) | A close beyond the last swing in the trend's direction | Trend continuation, new higher high |
| Change of character (CHoCH) | A close beyond the last swing against the trend | Trend break, 1-2-3 reversal |
| Fair value gap (FVG) | Candle 1's wick and candle 3's wick do not overlap | Runaway gap, imbalance |
| Order block (OB) | Last opposing candle before a strong move | Demand / supply zone, "the base" |
| Breaker block | A failed zone revisited from the other side | Support turned resistance |
| Premium / discount | Upper / lower half of the current swing | Above / below the 50% retracement |
SMC's genuine contribution is packaging: tighter definitions than most supply-and-demand teaching, and an explicit sequence. That sequence is the backbone of this course.
The sequence you are going to build
Every module in this course teaches one link in a chain. The chain is: bias, liquidity, sweep, shift, entry, target.
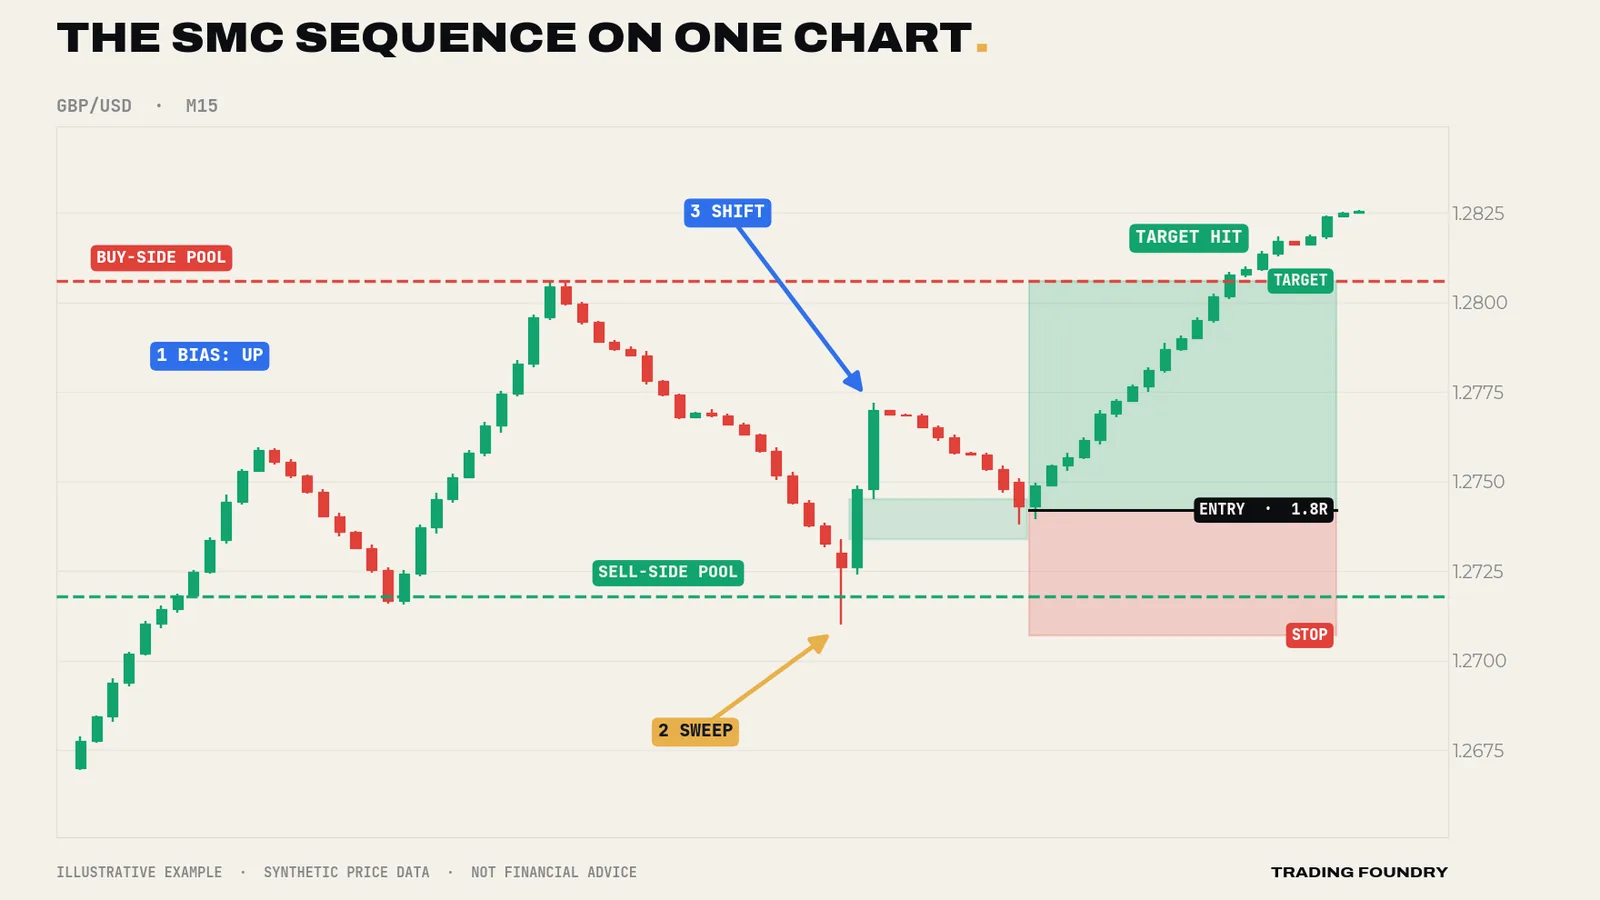
- Bias — the higher-timeframe trend, defined by swings (Module 1).
- Liquidity — where stops and pending orders are likely to cluster (Module 2).
- Sweep — price trades through a cluster and fails to hold beyond it (Module 2).
- Shift — a decisive break of structure back in the direction of the bias (Module 1).
- Entry — a defined zone created by the shift: a fair value gap or order block, in discount (Module 3).
- Target — the opposing cluster of stops (Modules 2 and 4).
Each step is a gate. If the market skips one, there is no trade. You will find that the strategy's value comes less from the setups it finds and more from the ones it refuses.
The four limits, stated up front
You are paying for honesty, so here are SMC's weaknesses before you invest twelve lessons in it.
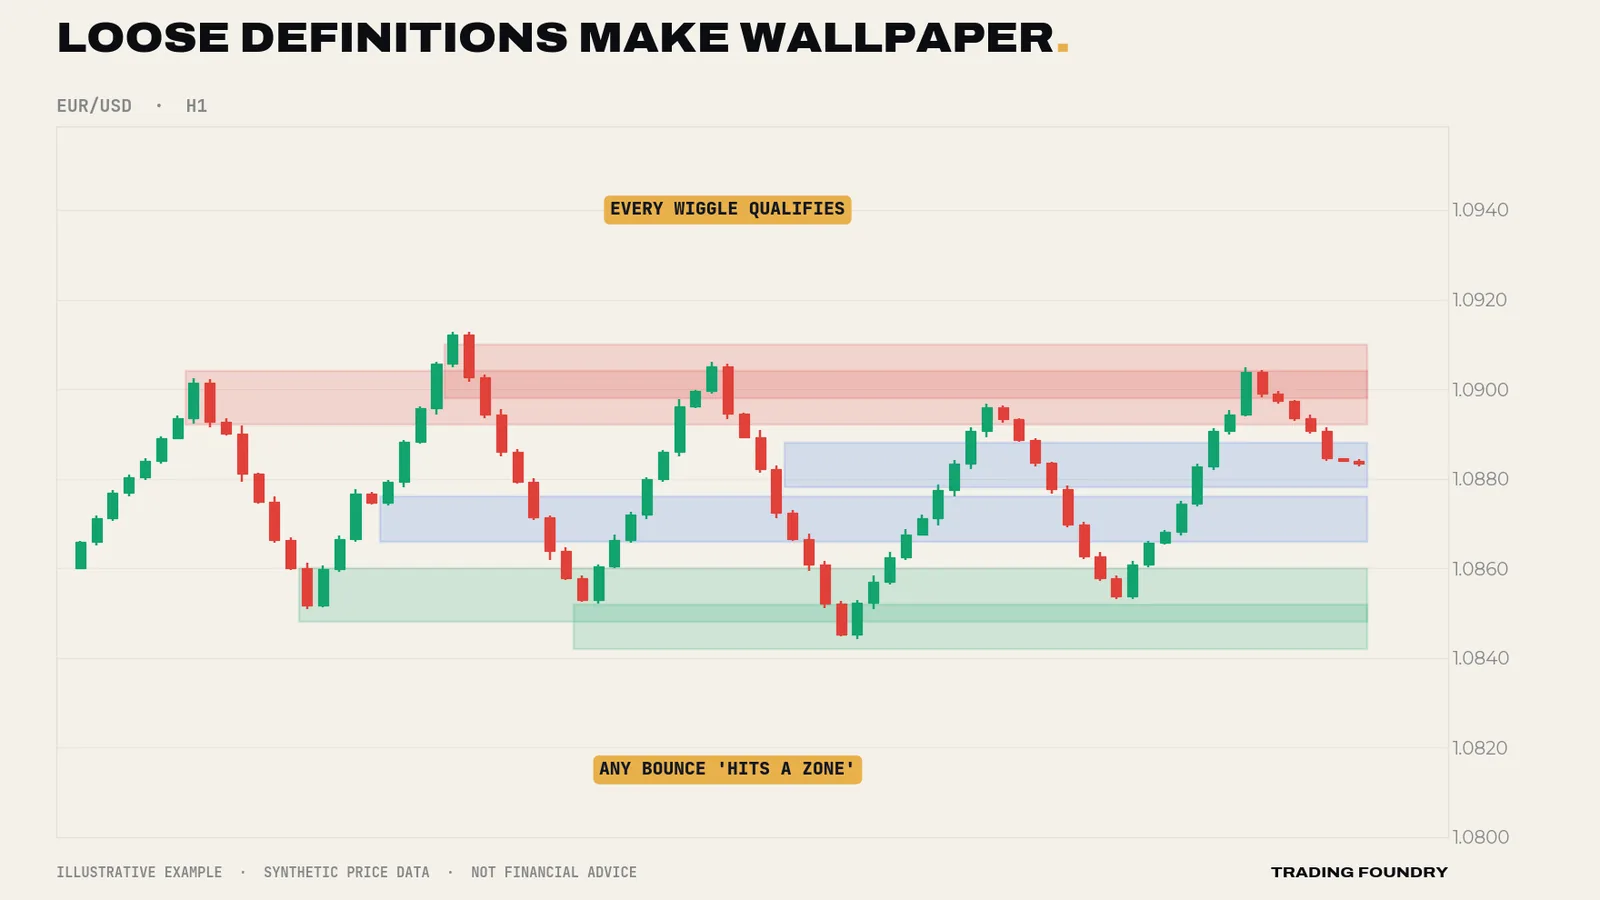
1. Subjectivity. By its loosest definition, every wiggle has an order block. Two competent traders will mark different zones on the same chart, which makes rigorous testing hard and cherry-picked examples easy.
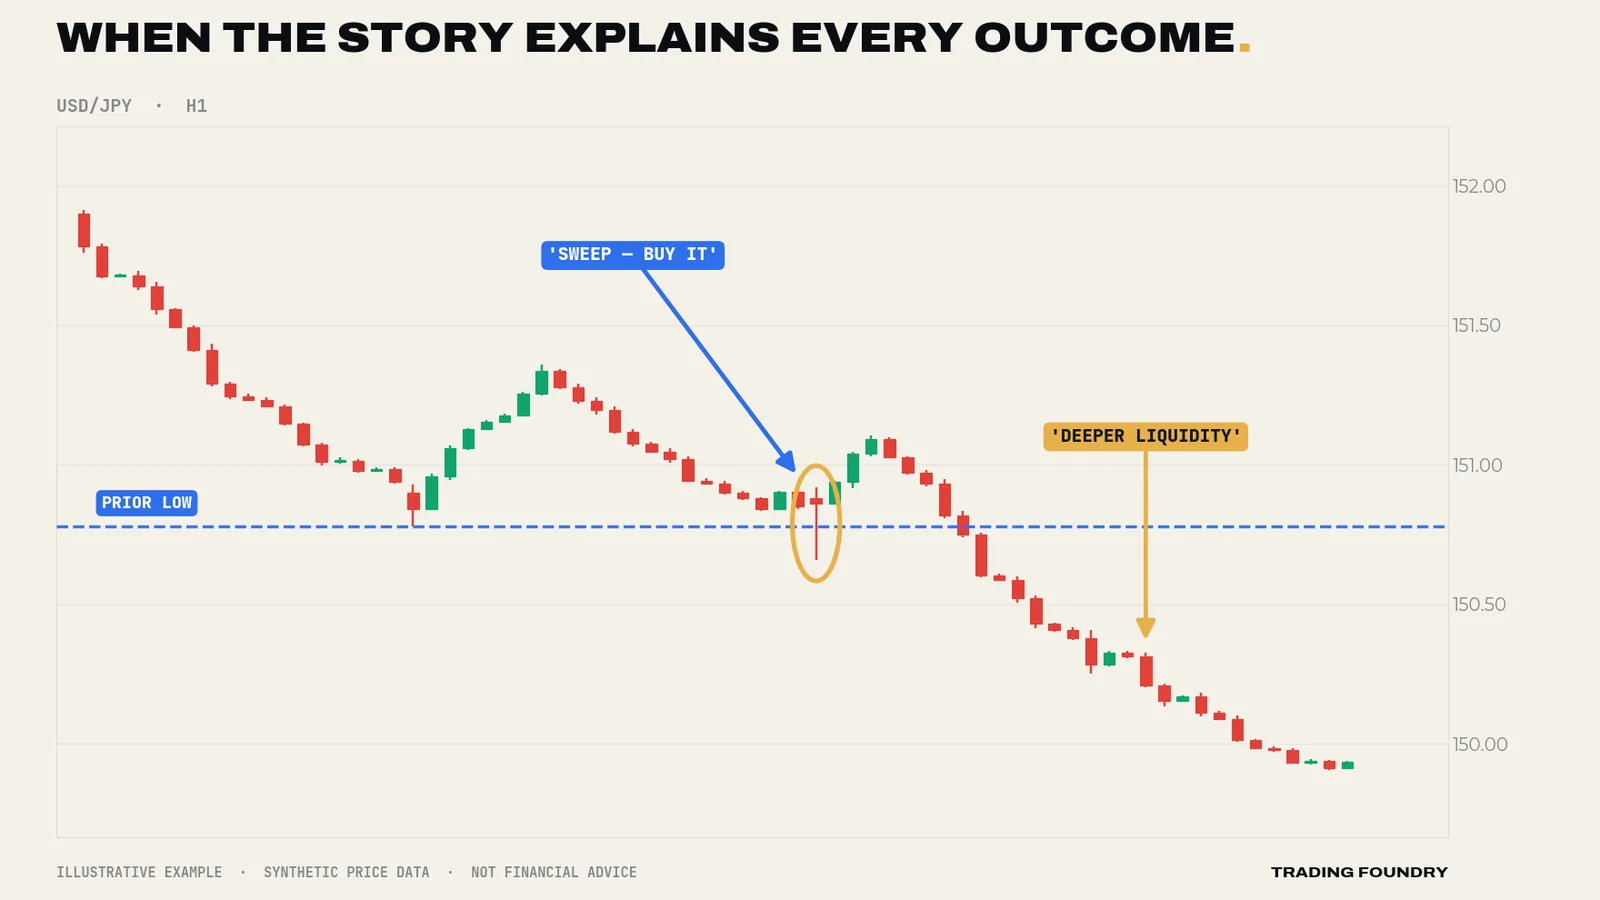
2. Unfalsifiability. The framework has enough optional parts that a determined believer can explain any outcome after the fact. If a zone holds, the order block worked. If it fails, price was "seeking deeper liquidity". A theory that explains everything predicts nothing.
3. Crowding. SMC is now enormously popular. Its textbook zones are drawn on hundreds of thousands of screens, which means they collect the very stop clusters the framework says get targeted. Your "smart money" entry is, statistically, a retail entry.
4. Survivorship marketing. The loudest SMC voices sell education, not audited track records. That does not prove the ideas fail. It does mean you should test them rather than trust them.
How this course treats every concept
Every concept from Lesson 2 onwards gets three things:
- An objective definition — written so that a stranger, given only your rule, would mark the same thing on the same chart. Call it the stranger test.
- The observable reason it might matter — the order-placement or crowd-behaviour mechanism you can reason about without inside knowledge.
- The failure case — what it looks like when the concept does not work, shown on a chart, with what you do about it.
Risk is handled the same way throughout. Every example has a stop. Position size is set from the stop distance at a fixed fraction of the account — 0.5% to 1% per trade in our illustrations — never the other way round. And every chart in this course is a training chart: illustrative, built to teach one idea clearly, not a record of a real market day.
Going deeper
Write the observation before the label. For your first month with this material, keep a two-column journal: what price did (in pips, closes, candle counts) on the left; the SMC label on the right. You will notice how often the right-hand column smuggles in certainty the left-hand column does not support — "institutional order block" where the left column only says "last down candle before a 40-pip rally". That gap is where most bad SMC trades are born.
Falsifiability as a design rule. For every rule you adopt, write down what would prove it wrong in a sample of trades. "Sweeps of the Asian low that close back inside within three M15 candles, followed by an M15 close above the last internal lower high, produce positive expectancy on EUR/USD" can be wrong, so it can be tested. "Price seeks liquidity" cannot be wrong, so it cannot be tested. Lesson 11 turns this into a backtesting protocol.
Both stories predict the same chart. For a sweep, the institutional story ("a large buyer filled into forced selling") and the mechanical story ("forced selling ran out, trapped sellers covered") predict identical candles. You do not need to know which is true to trade the pattern. You do need to know that you cannot know, so you never mistake folklore for evidence — and never size up because the story felt convincing.
Why the sequence matters more than any single concept. Each SMC element alone is weak: a gap alone is just a fast candle; an order block alone is just a candle. What gives the framework a chance of an edge is the conjunction — a sweep at an obvious level, then a structural break with real displacement, then a pullback to a defined zone in the cheap half of the range, in the direction of the higher-timeframe trend. Requiring all of them filters out most of the market. That filtering, plus the tight stop geometry it allows, is the honest case for SMC.
- Describe price first in observable terms (closes, pips, candle counts); apply the SMC label second.
- Never trade a motive you cannot see. Trade the chart event.
- Every concept must pass the stranger test: written precisely enough that someone else would mark the same thing.
- Every trade has a stop; size comes from the stop distance at a fixed risk of 0.5–1% of the account.
- A loss is data about the rules, never evidence of manipulation.
Summary
- SMC is a model of price behaviour wrapped in an institutional story you cannot verify. Learn the model; hold the story loosely.
- Price first, framework second: write what the chart shows, then name it.
- Most SMC concepts have older classical names; the framework's real contribution is tighter definitions and a sequence.
- The sequence — bias, liquidity, sweep, shift, entry, target — is a chain of gates. Missing gates mean no trade.
- The framework's weaknesses are subjectivity, unfalsifiability, crowding and marketing. Objective rules and your own testing are the cure.
Quick quiz.
Education only, not financial advice. Charts are illustrative training examples using synthetic price data, not real market history or results.