 TRADING FOUNDRY
Why Chasing Loses — and How the Pullback Fixes It.
Explain why entering a trend on a pullback gives you a better price, a tighter stop and a clearer reason to be wrong than chasing the move.
You have seen this happen, probably more than once. A pair starts trending. You notice it late, after a run of strong candles. It looks unstoppable, so you buy. Within a few hours price dips, your stop goes, and then — with you safely out — the trend carries on exactly as you expected.
The usual conclusion is "I was wrong". Usually you were not. Your read of direction was fine. What was wrong was the price you paid and the place you put your stop. You bought at the most stretched point of the move, and you placed your stop inside the market's normal breathing room.
This course is about fixing that. The trend pullback strategy is not clever. It does not predict tops or bottoms. It does one simple thing: it waits for a trending market to retreat, then joins the trend again when there is evidence the retreat is over. That waiting changes the entire geometry of the trade — the entry, the stop and the reward available — and it gives you a clean, objective reason to know when you are wrong.
The problem with chasing
Look at the first chart. The trend is obvious: a higher high, a higher low, then a powerful run of green candles. The chaser buys after that run, at the top of the leg.
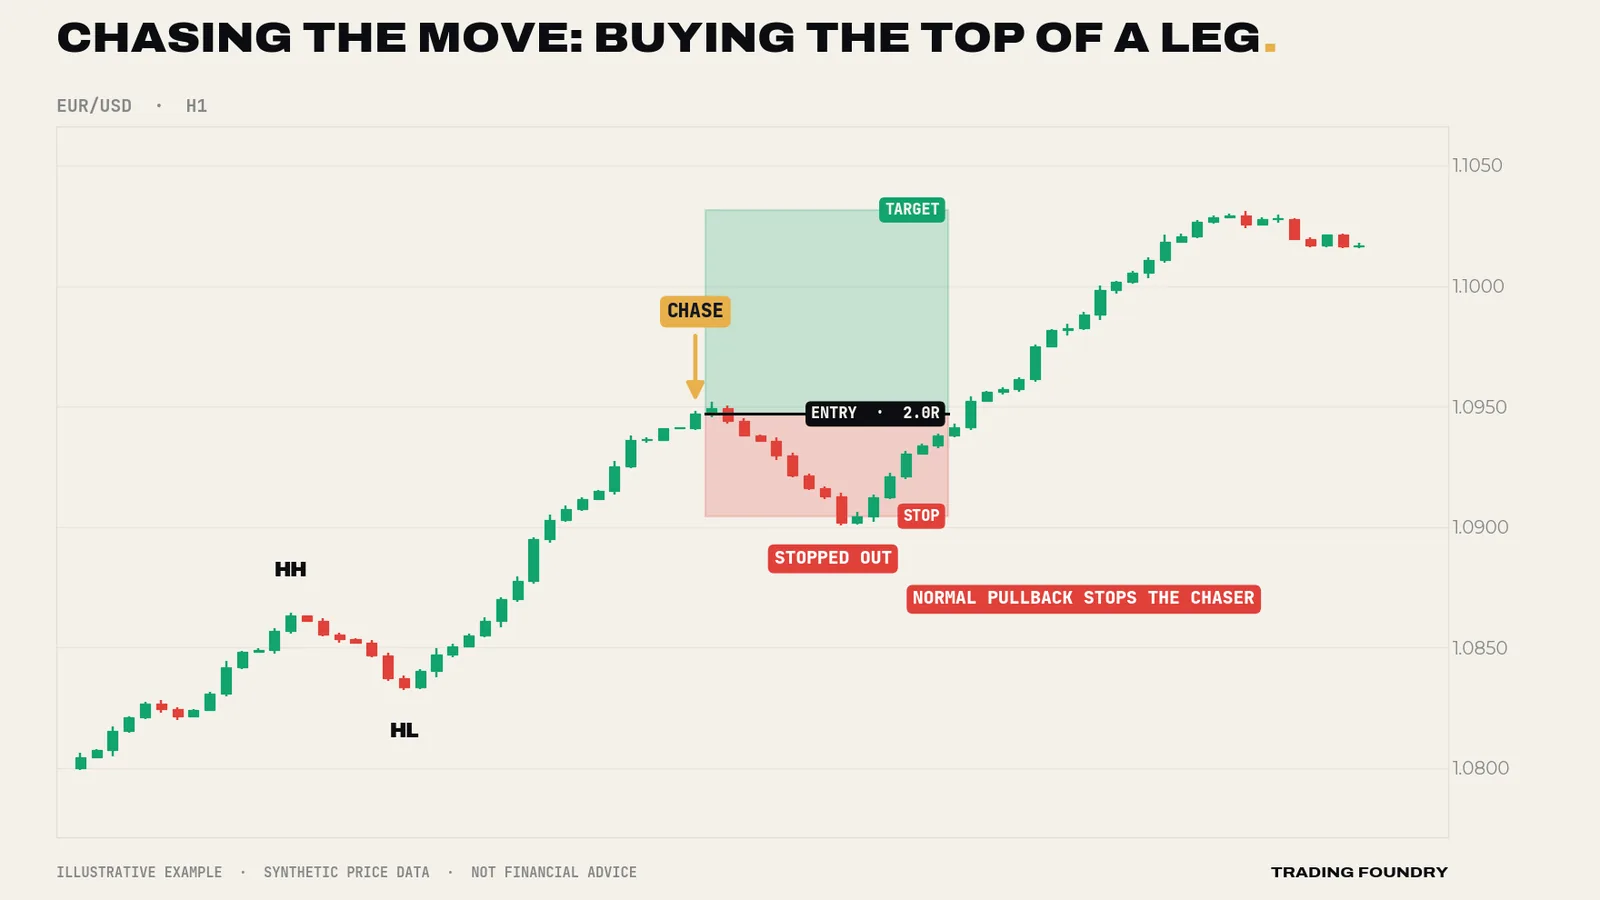
Three things went wrong, and none of them was the direction.
First, the price was poor. After five or six strong candles, buyers who wanted in have mostly got in. The market is stretched away from its recent average price. Statistically, that is where short-term pullbacks start, not where they end.
Second, the stop had no meaning. The chaser put a stop roughly 40 pips below entry because 40 pips "felt reasonable". But there was nothing at that level — no swing low, no structure, nothing whose break would prove the trend had failed. The stop sat in empty space, inside the range a normal pullback was always likely to cover.
Third, the trade had no answer to the question "what would make me wrong?" The only honest invalidation level for this uptrend was the higher low far below. A stop there would have meant risking over 100 pips for an entry at the top of a leg. Either the stop is meaningless, or the risk is enormous. That is the chaser's trap.
The same trend, a better price
Now the same candles, traded differently. Nothing about the market has changed. The trader simply waited.
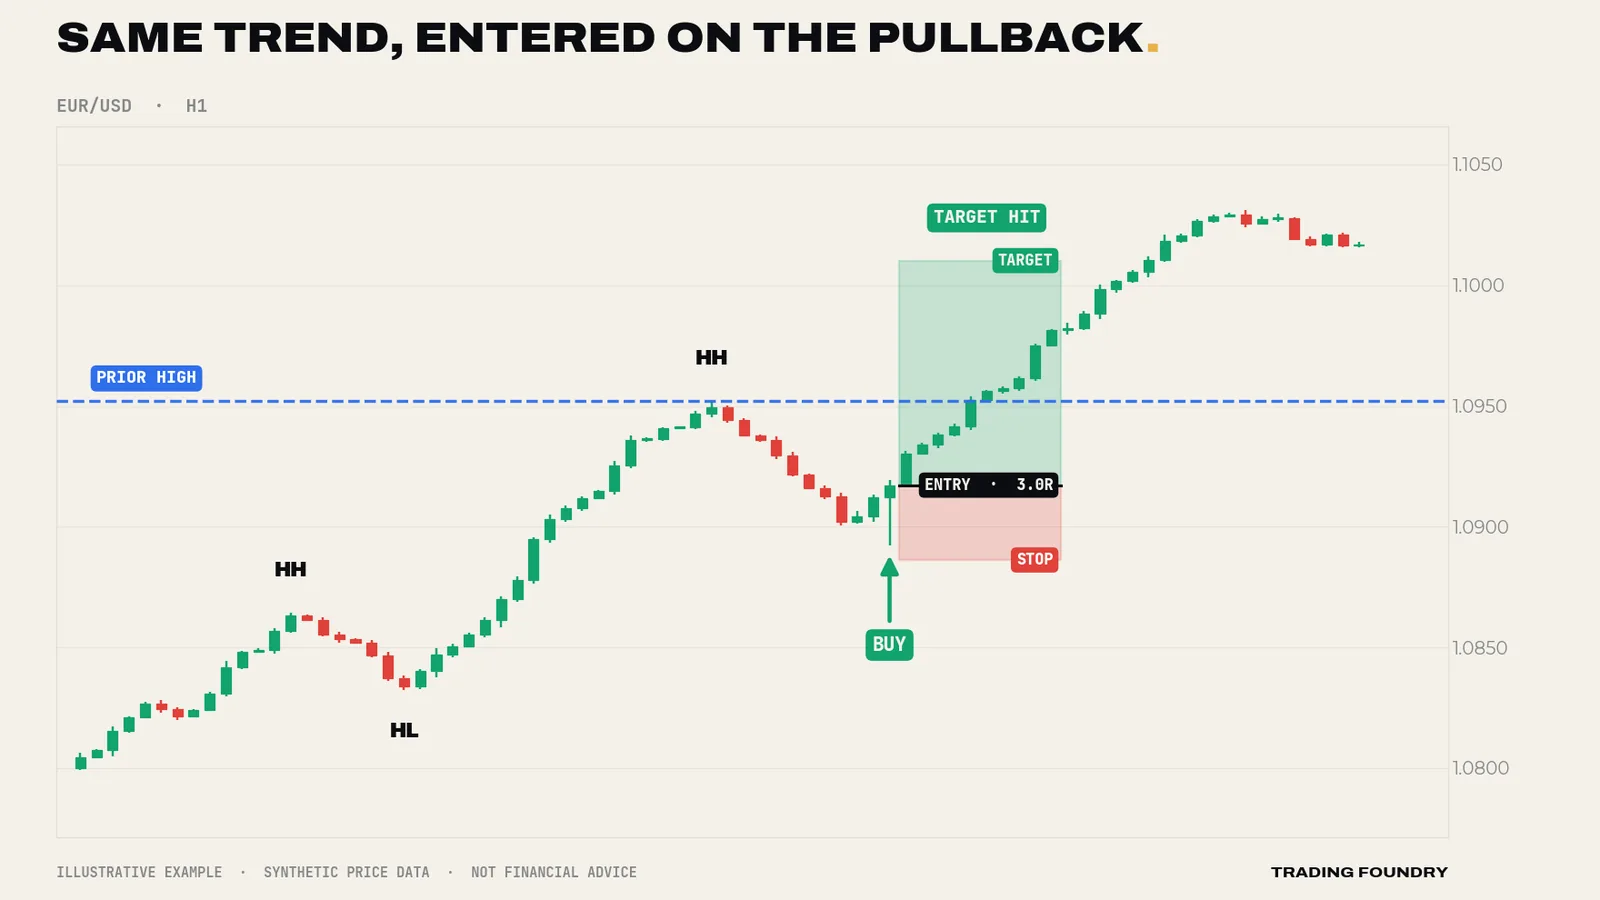
Price pulled back from the new high, as trends routinely do. It drifted lower for several candles, then printed a candle with a long lower wick — sellers pushed down, buyers pushed it back. The trader bought on the close of that candle and placed the stop a few pips beneath its low.
Notice what has happened to the trade.
- The entry is lower. The trader bought roughly 30–40 pips below where the chaser bought, in the same trend.
- The stop is meaningful. It sits below the low of the pullback. If price trades back through that low, the idea "the pullback has ended" is simply wrong — and the trader knows within a few candles.
- The reward is larger relative to the risk. Because the stop is tight and the entry is low, the prior high alone is already worth more than the risk, and a target at three times the risk (3R) is within the trend's normal reach.
This is the whole case for the pullback, in one picture. Same market, same direction, completely different trade.
Trends breathe
Why do pullbacks happen at all? Because trends are not straight lines. They move in a rhythm: a fast, strong leg in the trend's direction (the impulse), followed by a slower, smaller drift against it (the pullback, sometimes called a correction or retracement), followed by another impulse.
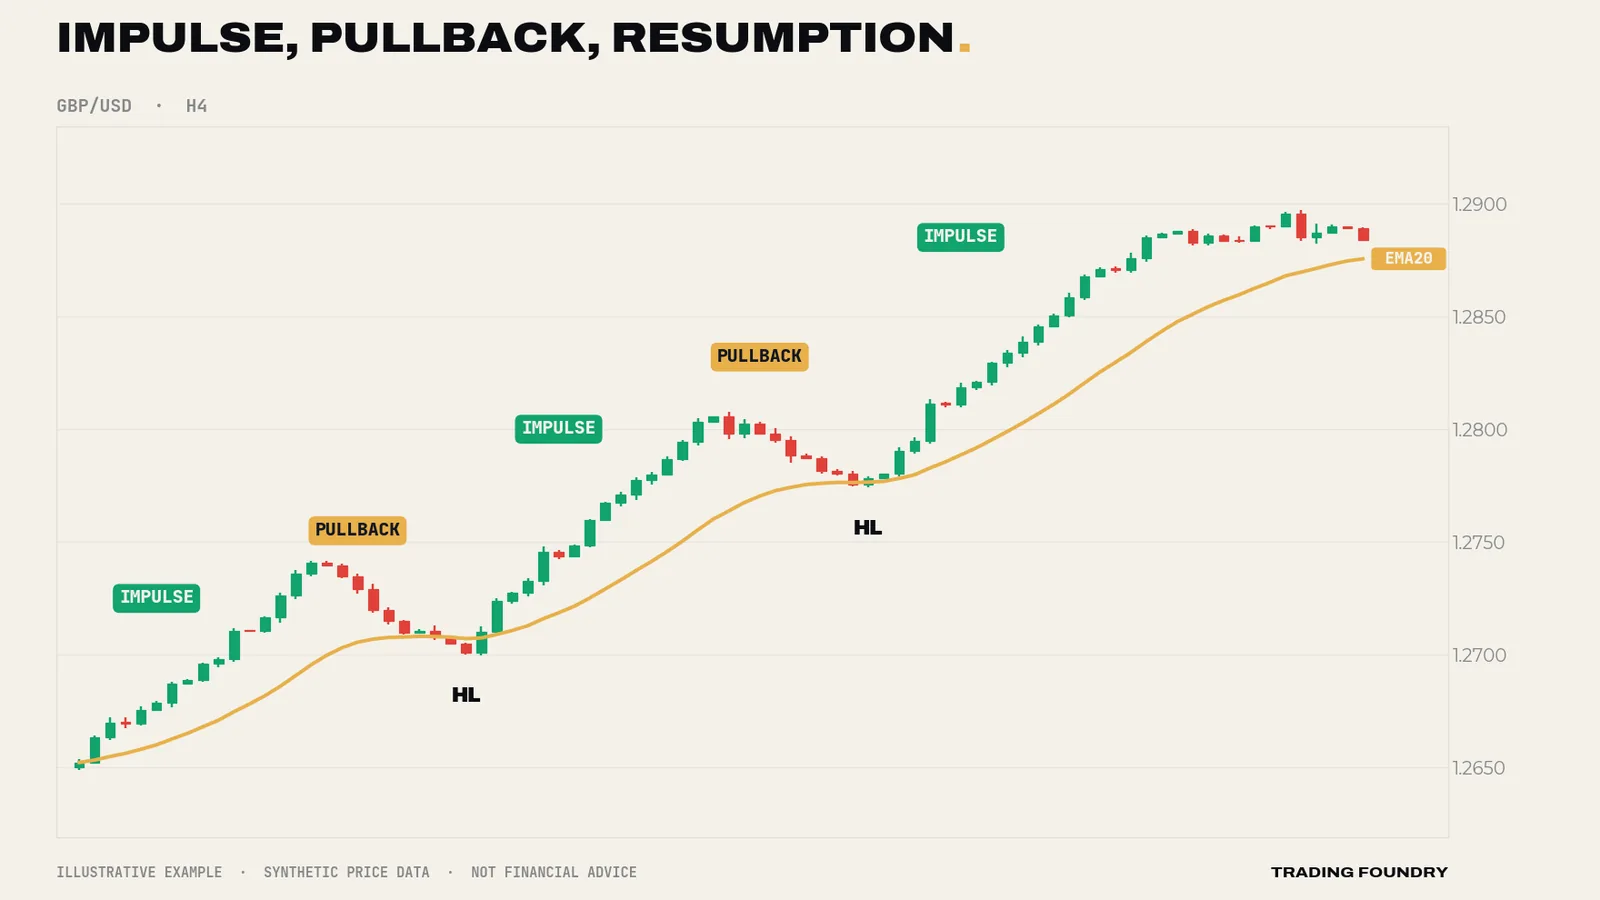
The impulse is the market moving with intent — large candles, mostly one colour, covering ground quickly. The pullback is the market catching its breath: earlier buyers taking profit, newer ones deciding where they want in. In a healthy uptrend, the pullback ends above the previous pullback low, and the next impulse takes price to a new high.
This rhythm is what the strategy exploits. We do nothing during the impulses — that is chasing. We watch during the pullbacks. We act only when the pullback appears to be ending and the next impulse appears to be starting.
The four questions
Every trade in this course comes from answering four questions, in order. A "no" at any stage means no trade.
- Is there a trend? Not "does it look like it's going up" — an objective answer, based on swing structure: higher highs and higher lows, or lower highs and lower lows. Module 1 makes this mechanical.
- Is this a pullback, or a reversal? A healthy pullback is slower, smaller and more hesitant than the impulse before it, and it holds the last higher low. A reversal looks different, and Module 2 shows you how.
- Has the pullback reached a sensible place? Pullbacks tend to end in a few recognisable areas: around the 20 or 50 EMA, at the old breakout level, or between 38% and 62% of the prior impulse. Ideally several of those agree.
- Is there evidence the pullback has ended? A rejection candle, or a break of the pullback's own small structure. We never buy simply because price has arrived somewhere. Module 3 covers triggers, stops and targets.
Sitting above all four is one more: does the higher timeframe agree? A one-hour pullback in the direction of the four-hour trend is a very different proposition from one fighting it.
Where this strategy does not work
Be clear about this from the start: the pullback strategy is a trend strategy. When there is no trend, it has nothing to offer.
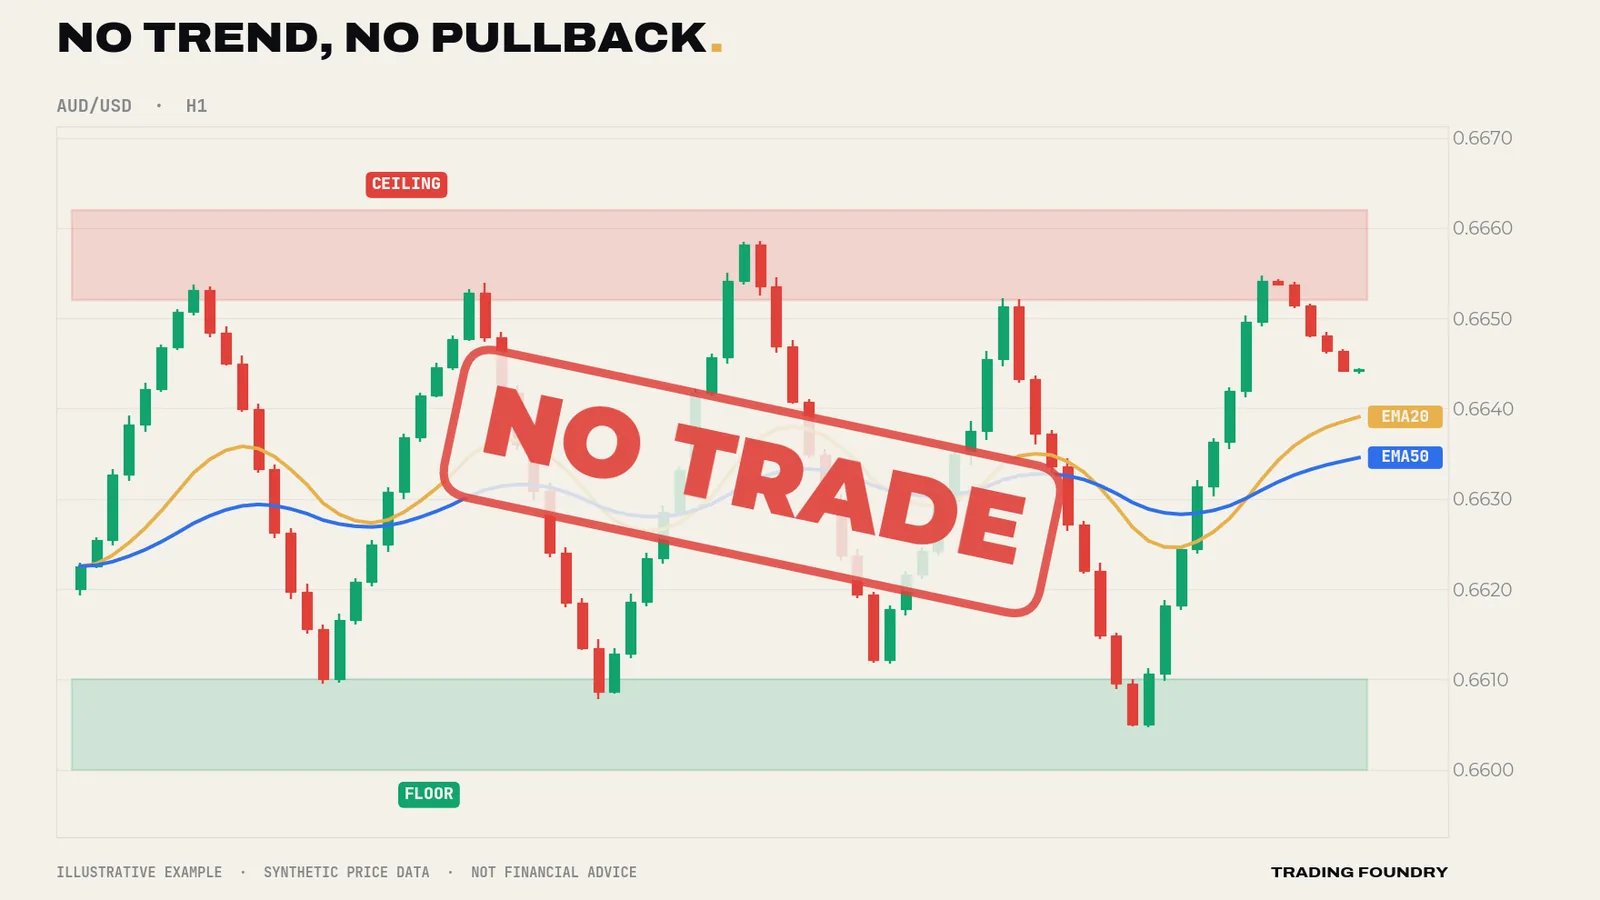
In a range, price swings between a ceiling and a floor. The moving averages flatten and weave through the middle of the candles. Every drop towards the floor looks a little like a pullback; every bounce looks a little like a new trend. A trader who applies pullback rules here will take entry after entry that goes nowhere — small losses, again and again.
The strategy's most important skill is therefore refusing entries. Most of the time the four questions do not all come back "yes", so most of the time you do nothing. That is not a flaw. It is the point.
How this course is built
Module 1 makes the trend objective: swing structure, trend lines and moving-average filters. Module 2 dissects the pullback itself — healthy or not, and how deep. Module 3 covers execution: triggers, stops, targets, sizing and multi-timeframe alignment. Module 4 covers when not to trade, then hands you the complete playbook. Every chart is an illustrative training chart, not real market data, and nothing here is a signal to trade any market.
Going deeper
For experienced traders, the case for the pullback is really an argument about risk geometry and invalidation.
Every trade has a thesis — "this uptrend will continue" — and a point at which the thesis is proven wrong. For a trend, that point is structural: in an uptrend, the most recent confirmed higher low. The further your entry is from that point, the more you must risk to give the thesis room. Chasing maximises that distance. Pullback entries minimise it, because you are entering near the low of the pullback, which is close to the structure that would invalidate you.
The course uses two kinds of stop:
- The trigger stop — beyond the low of the pullback itself. Tight, cheap, and invalidated if the pullback simply continues. This is the default.
- The structural stop — beyond the last confirmed higher low of the trend. Wider, and invalidated only if the trend itself breaks. Useful when the pullback low and the trend's higher low are the same point.
A hypothetical illustration of why the geometry matters. Suppose two traders each risk 1% of their account per trade. Trader A chases and can realistically aim for 1R before the next pullback. Trader B enters on pullbacks and aims for 2.5R. With these purely hypothetical numbers, Trader A needs to be right more than half the time just to break even; Trader B breaks even at under 30%. Neither figure is a promise of anything — real results depend on execution, costs and the market — but the arithmetic shows why the entry location, not the direction call, is where much of the edge in trend trading tends to live.
Two warnings. First, waiting has a cost: some trends never pull back to a sensible level, and you will miss them. That is the fee for refusing bad prices, and you should accept it in advance. Second, the tight trigger stop will be hit more often than a wide structural stop. Losses are part of the method. The aim is for them to be small, planned and explainable.
Summary
- Most chasing losses are a price-and-stop problem, not a direction problem.
- Trends move in a rhythm of impulse and pullback; this strategy acts only as a pullback ends.
- Every trade answers four questions in order: trend, pullback, location, evidence — plus higher-timeframe agreement.
- A pullback entry puts the stop close to a level that genuinely proves you wrong, which makes larger rewards relative to risk realistic.
- In a range there is no trend to pull back from, so the strategy stands aside.
Quick quiz.
Education only, not financial advice. Charts are illustrative training examples using synthetic price data, not real market history or results.