 TRADING FOUNDRY
Risk Per Trade and Position Sizing — The Maths That Keeps You Trading.
Choose a fixed risk per trade, calculate the exact position size for any stop on any pair in your own account currency, and measure results in R.
If you take one lesson from this course into every trade you ever place, make it this one. Pattern reading, levels, timing — all of it matters, but none of it protects you if a single trade can do serious damage to your account. Position sizing is what makes losses small, equal and survivable. It turns trading from a series of bets into a process you can measure and improve.
The idea is simple: decide in advance how much of your account you are prepared to lose if a trade is wrong, put the stop where the chart says the idea is wrong, and then calculate the position size that makes those two numbers agree. The stop comes from analysis. The risk comes from your rules. The position size is the output — never the input.
This lesson works through the maths in full, with four worked examples in pound and dollar accounts. All exchange rates and figures are illustrative.
Step one: risk a fixed percentage
Professional and serious retail traders typically risk a small, fixed percentage of their account on each trade. For learning and early live trading, this course uses 0.5% to 1%.
On a £5,000 account:
- 1% risk = £50 per trade.
- 0.5% risk = £25 per trade.
Why a percentage rather than a fixed amount? Because it scales automatically. After a run of losses, 1% of a smaller account is a smaller amount, so you lose more slowly when things are going badly. After a run of wins, it grows with you. And it makes every trade the same size in risk terms, so no single trade can matter more than any other.
Why so small? Because losing streaks are normal. Even a sound method can produce long runs of consecutive losses over a few hundred trades. Look at what streaks do at different risk levels:
| Risk per trade | After 5 losses | After 10 losses | Gain needed to recover from 10 |
|---|---|---|---|
| 0.5% | −2.5% | −4.9% | +5.1% |
| 1% | −4.9% | −9.6% | +10.6% |
| 2% | −9.6% | −18.3% | +22.4% |
| 5% | −22.6% | −40.1% | +67.0% |
At 1%, ten losses in a row is an unpleasant fortnight. At 5%, it is a disaster that takes a 67% gain just to undo. The method is the same; only the size changed.
Step two: put the stop where the chart says
The stop belongs where the trade idea is proven wrong — beyond the support or resistance zone and beyond the trigger candle's wick, plus a small buffer for the spread (Lessons 9 and 10). Measure the distance from entry to stop in pips.
You do not move the stop closer to allow a bigger position, or further away because a round number feels nicer. The chart decides the stop.
Step three: calculate the position size
The one formula:
Position size (lots) = money at risk ÷ (stop distance in pips × pip value per lot)
with the pip value per lot expressed in your account currency (Lesson 2).
Worked example 1: pound account, pound-quoted pair
- Account £5,000, risk 1% = £50.
- Pair EUR/GBP, stop 25 pips.
- Pip value per lot: £10 (quote currency is GBP).
- Size = £50 ÷ (25 × £10) = £50 ÷ £250 = 0.20 lots.
- Check backwards: 0.20 × £10 = £2 per pip; × 25 pips = £50. Correct.
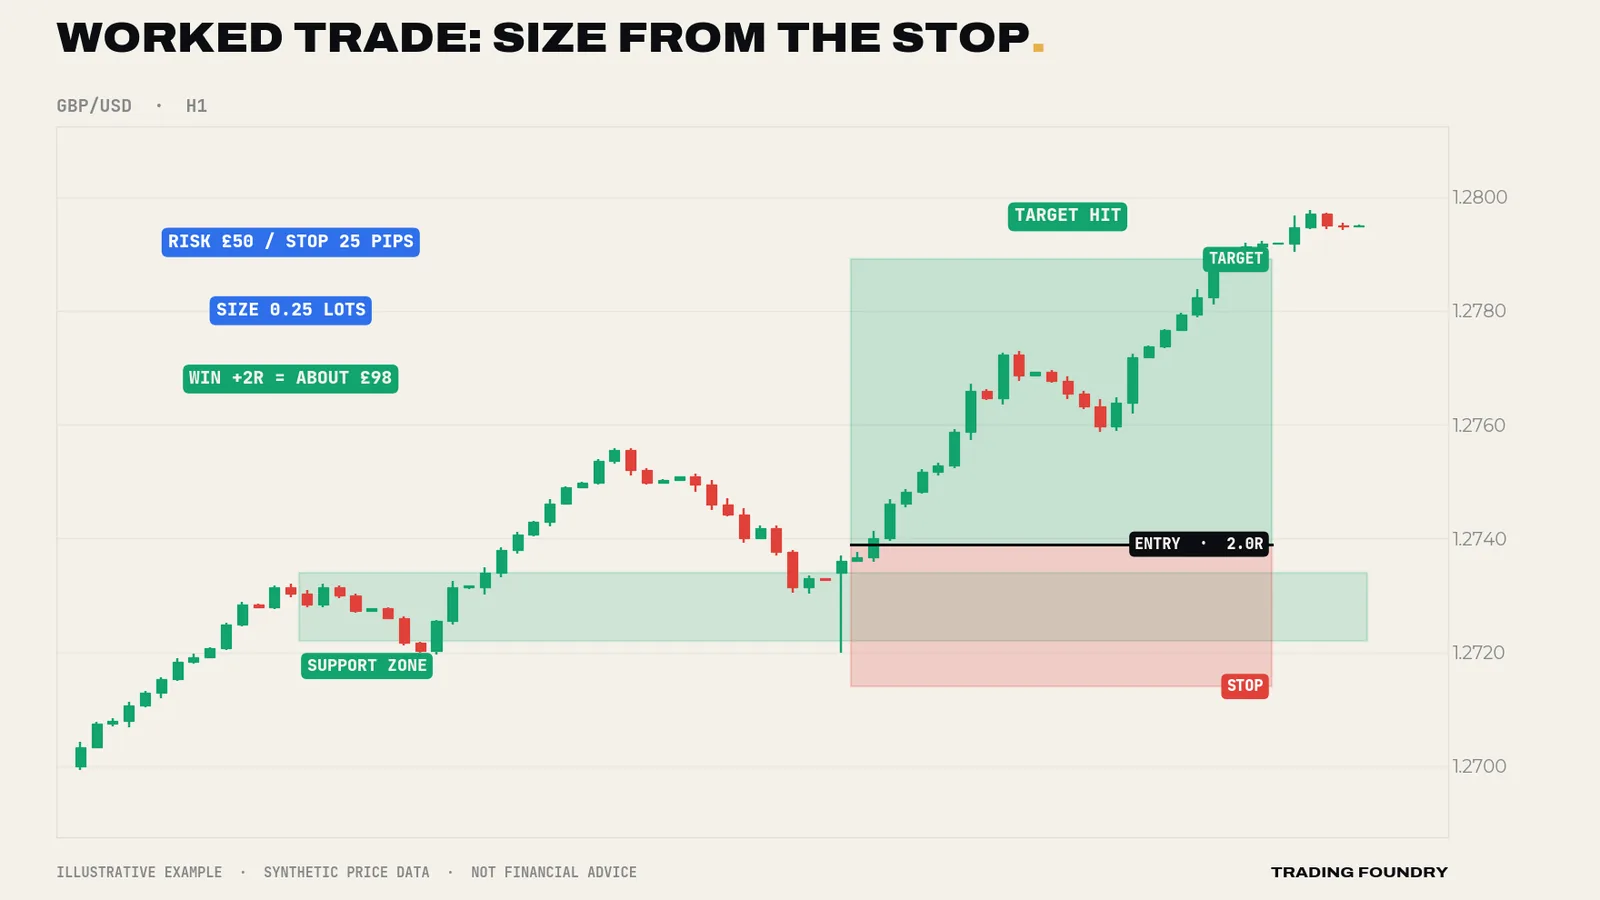
Worked example 2: pound account, dollar-quoted pair
- Account £5,000, risk 1% = £50.
- Pair GBP/USD, stop 25 pips. GBP/USD rate 1.2700.
- Convert the risk into dollars: £50 × 1.27 = $63.50.
- Pip value per lot: $10.
- Size = $63.50 ÷ (25 × $10) = 0.254 → round down to 0.25 lots.
- Check: 0.25 × $10 × 25 = $62.50 = £49.21. Just under £50 — the right side to miss on.
Worked example 3: pound account, yen pair
- Account £5,000, risk 1% = £50.
- Pair USD/JPY, stop 40 pips. GBP/JPY rate 190.50.
- Pip value per lot: ¥1,000 ÷ 190.50 = £5.25.
- Size = £50 ÷ (40 × £5.25) = £50 ÷ £210 = 0.238 → round down to 0.23 lots.
- Check: 0.23 × £5.25 × 40 = £48.30.
Worked example 4: dollar account
- Account $10,000, risk 0.5% = $50.
- Pair EUR/USD, stop 20 pips. Pip value per lot $10.
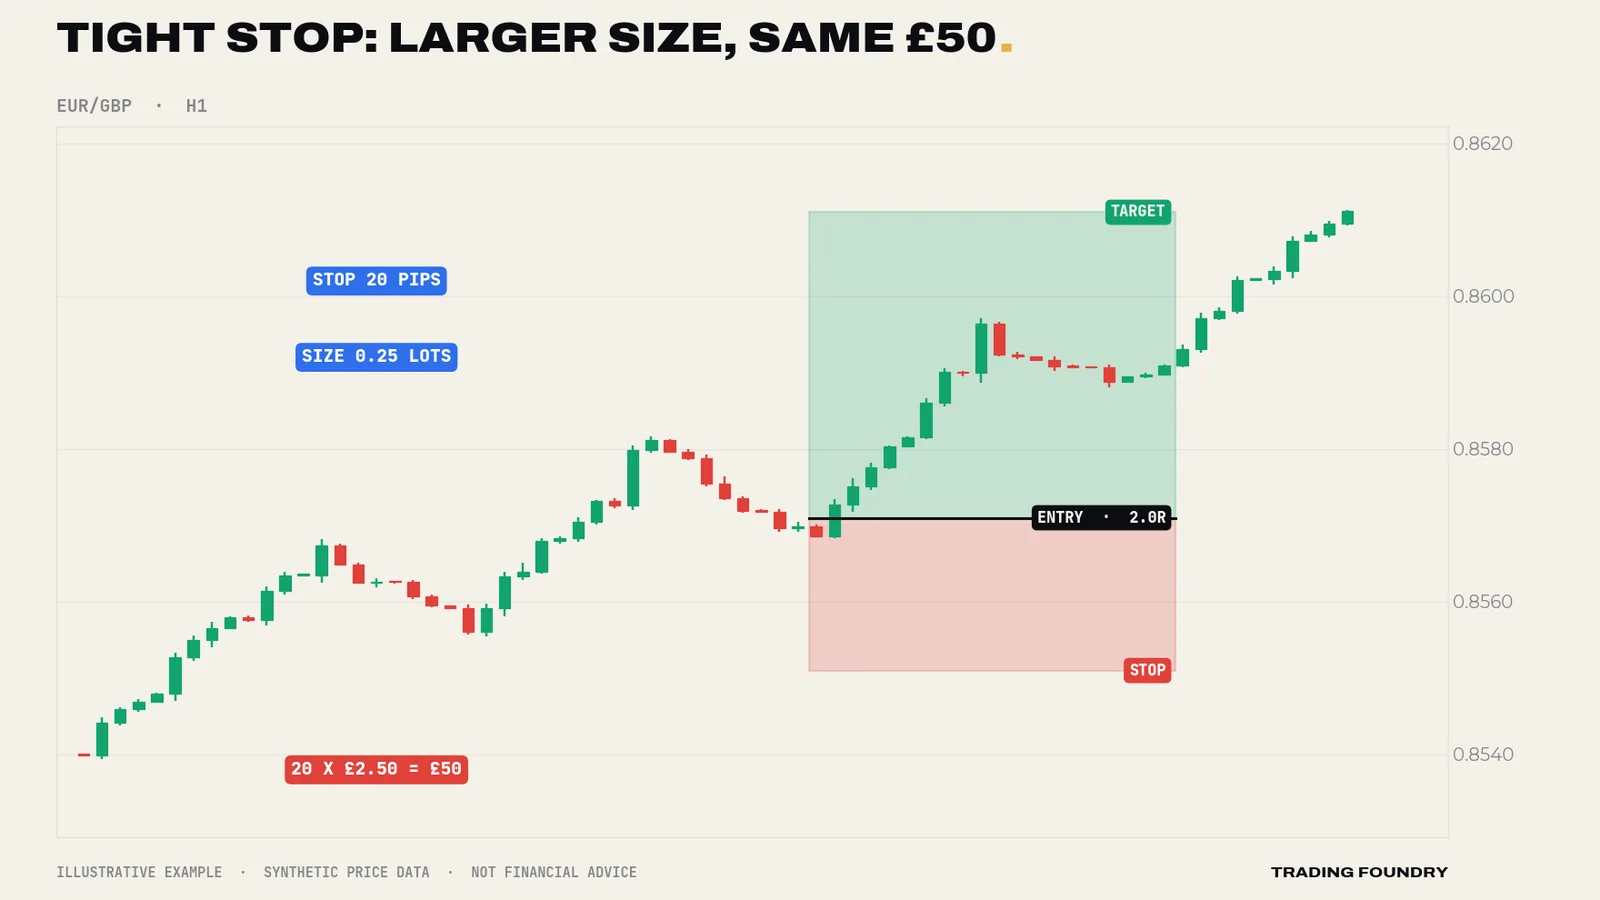
- Size = $50 ÷ (20 × $10) = 0.25 lots.
Notice the pattern in every example: round down, never up. Rounding up "because it's only a bit" is how 1% becomes 1.2%, then a habit.
The see-saw: stop distance and size
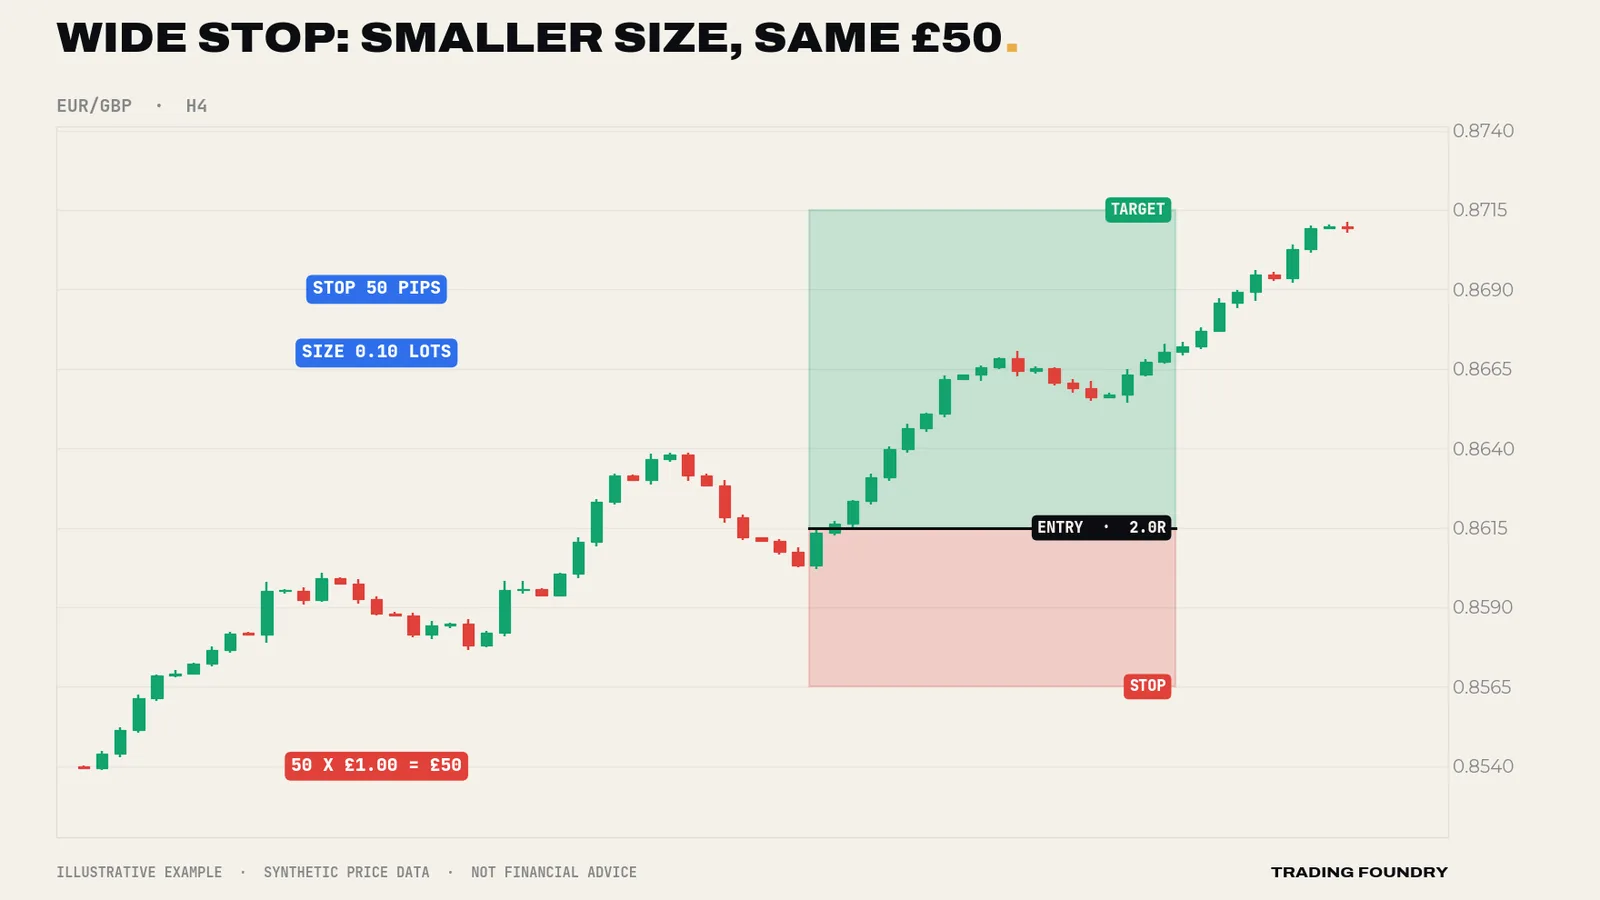
Here is the idea that clicks for most people once they see it. A wider stop does not mean "risking more". It means trading a smaller position, so the money at risk is unchanged.
Thinking in R
From now on, measure trades in R, where 1R is the amount you risked. Risked £50 and lost it: −1R. Made £100: +2R. Closed at break-even: 0R.
R makes every trade comparable, whatever the account size or pair, and it makes the most important relationship in trading easy to see. If your winners average 2R and your losers are 1R, the win rate you need just to break even (before costs) is:
Break-even win rate = 1 ÷ (1 + R)
- Winners average 1R → need 50% winners.
- Winners average 2R → need 33%.
- Winners average 3R → need 25%.
This is why this course insists on a target of at least 2R. It gives the plan room to be wrong more often than it is right and still not lose money — before costs, and assuming every loss really is 1R.
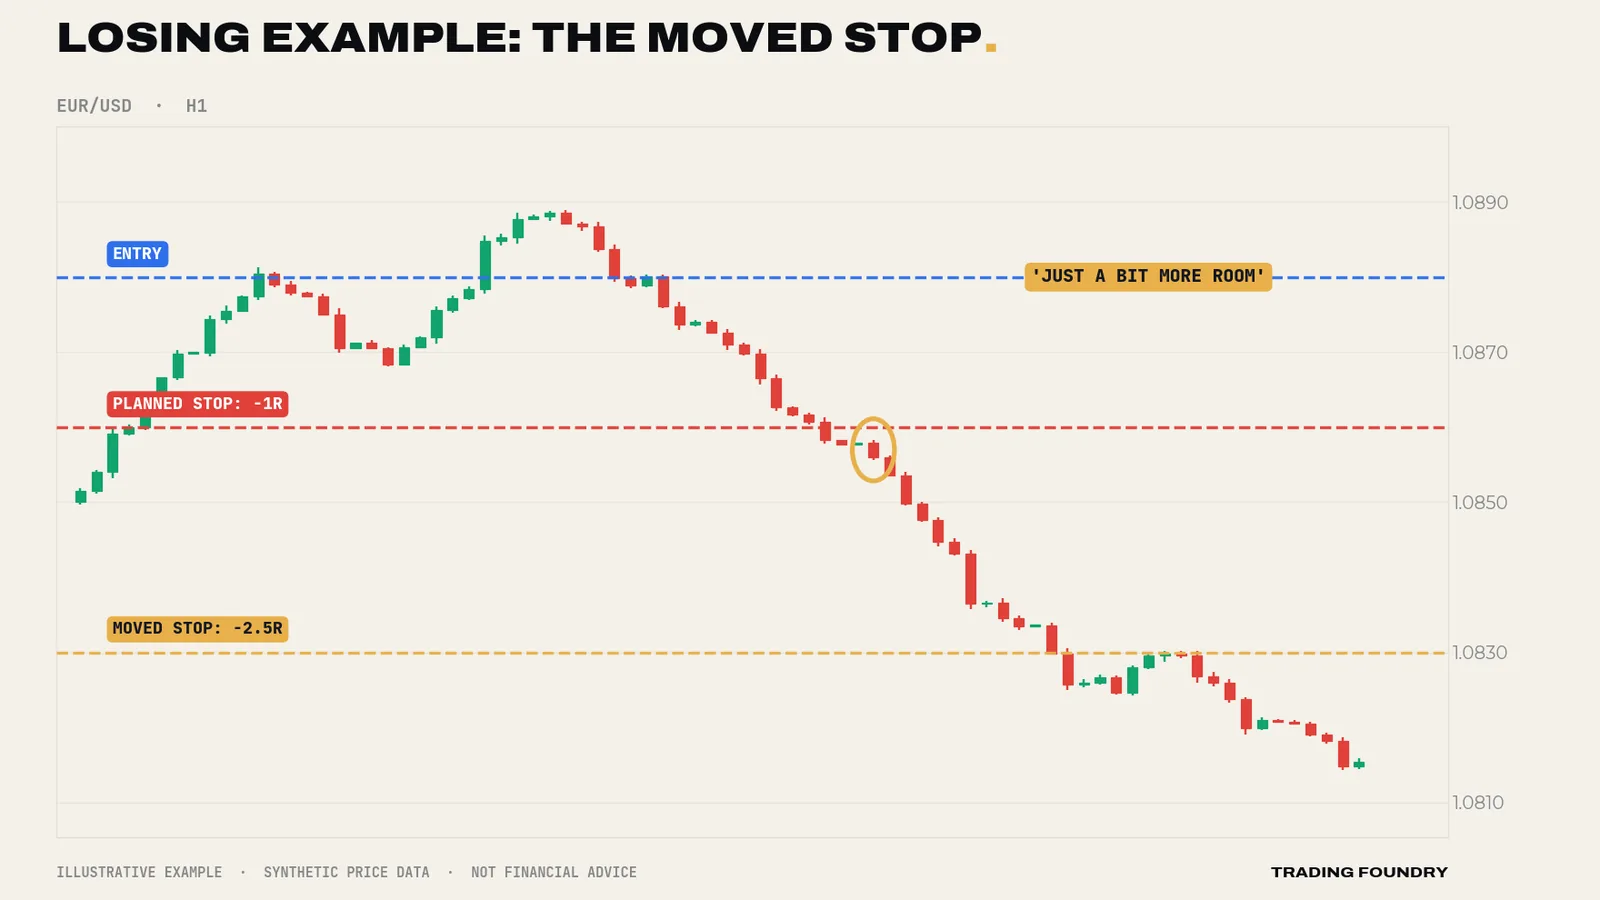
That last assumption is where many traders fall down.
Going deeper
Expectancy. Over many trades, the average result per trade in R is:
Expectancy = (win rate × average win in R) − (loss rate × average loss in R)
As a purely hypothetical illustration: a plan that wins 40% of the time with average winners of 2R and losses of exactly 1R has expectancy (0.40 × 2) − (0.60 × 1) = +0.20R per trade. If sloppy stop management lets the average loss drift to 1.3R, the same entries give (0.40 × 2) − (0.60 × 1.3) = +0.02R — almost nothing. Most struggling traders lose their edge in the loss column, not the entry column. These numbers illustrate the arithmetic; they are not a claim about any strategy.
Costs in the sizing. Your real loss at the stop includes the spread and any commission. On tighter stops (under about 15 pips), add your typical all-in cost to the stop distance when sizing. On a 12-pip stop with a 1.2-pip cost, size for 13.2 pips.
Minimum size. If the calculated size rounds below your broker's minimum (often 0.01 lots), the correct answer is to skip the trade or find a setup with a tighter valid stop — never to take it oversized. On a very small account this binds often, and that is useful information: the account may be better used for practice at micro size than for live trading at "real" stakes.
One trade at a time, and a daily stop. Two trades on correlated pairs (EUR/USD and GBP/USD, for instance) can lose together, so 1% each is really closer to 2% on one idea. For beginners: one open trade at a time, and stop for the day after two losses. These are boundaries that protect your decision-making on bad days, when it is least reliable.
Practice drill
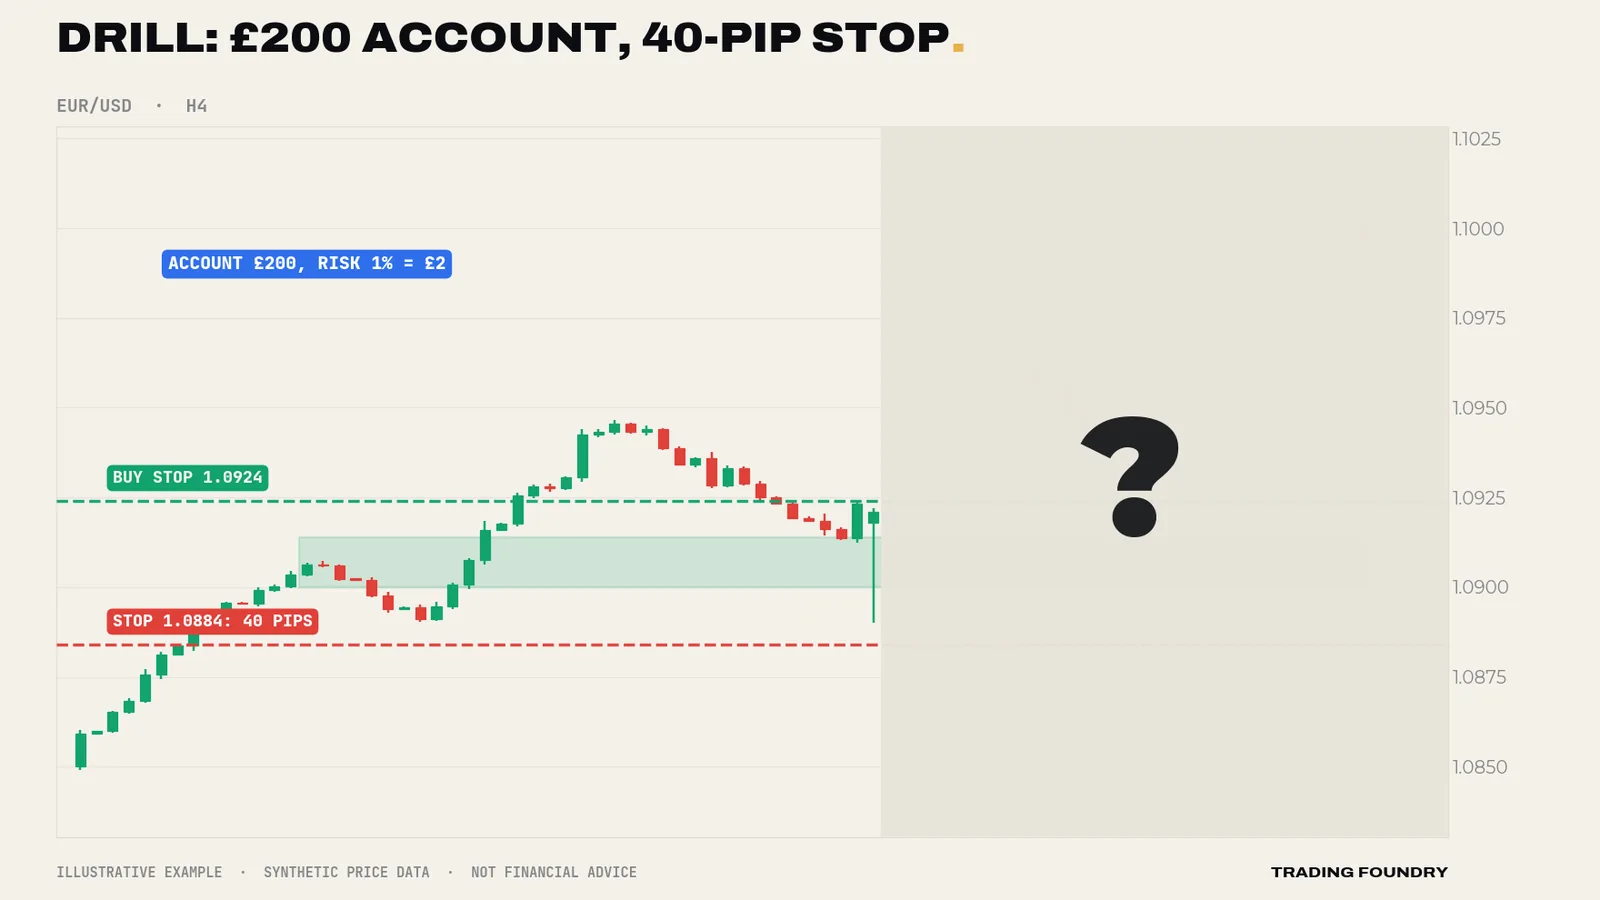
No trade — even though it would have won. The setup is good: an uptrend, a pullback into support and a clear rejection candle. But a buy stop above the candle at about 1.0924 and a stop below the wick at 1.0884 is 40 pips. The smallest size, 0.01 lots, is $0.10 per pip, about £0.079: 40 pips costs about £3.15, which is 1.6% of a £200 account, not 1%. You cannot size this trade within your rules, so you skip it. The reveal shows price rallying — and that does not change the answer. Judge decisions by the rules, not by one outcome.
- Risk a fixed 0.5–1% of the account per trade, chosen before looking at the chart
- The stop goes where the chart says the idea is wrong; size is calculated from it, never the other way round
- Round position size down, never up; if it rounds below the minimum, skip the trade
- Never move a stop further away
- One open trade at a time; stop for the day after two losses
- Risk amount in account currency written down (balance × risk %)
- Stop distance measured in pips, including a buffer for the spread
- Pip value per lot converted into account currency
- Size calculated, rounded down, and checked backwards
- Target at least 2R from entry
Summary
- Risk a small, fixed percentage per trade (0.5–1% while learning); losing streaks are normal and size decides whether they hurt or harm.
- Position size = money at risk ÷ (stop pips × pip value per lot), in your account currency, rounded down.
- Wider stop, smaller size; tighter stop, larger size — the money at risk stays the same.
- Measure trades in R. With 2R targets, you need about one win in three to break even before costs.
- A moved stop destroys the arithmetic; planned losses must stay 1R.
Quick quiz.
Education only, not financial advice. Charts are illustrative training examples using synthetic price data, not real market history or results.