 TRADING FOUNDRY
Reading a Candlestick Chart — Bodies, Wicks and the Close.
Read any candle's open, high, low and close, tell momentum, indecision and rejection candles apart, and judge whether a candle pattern means anything by where it formed.
Open any trading platform and the default chart is a row of little coloured bars with lines poking out of each end. Most beginners learn to say "green is up, red is down" and stop there. That is like learning to read by recognising the colour of the book covers.
Each of those bars is a candlestick, and each one is a compact summary of a fight between buyers and sellers over a fixed period of time. Learn to read that summary properly and a plain chart, with no indicators at all, starts telling you a great deal: who was in control, how hard the other side resisted, and whether that control is growing or fading.
This lesson teaches you to read single candles, then small groups of candles, and finally the most important idea in price action: a candle only means something because of where it formed. If you have watched the Trading Foundry film on why most traders cannot read charts, this is the longer, slower version.
Four prices, one picture
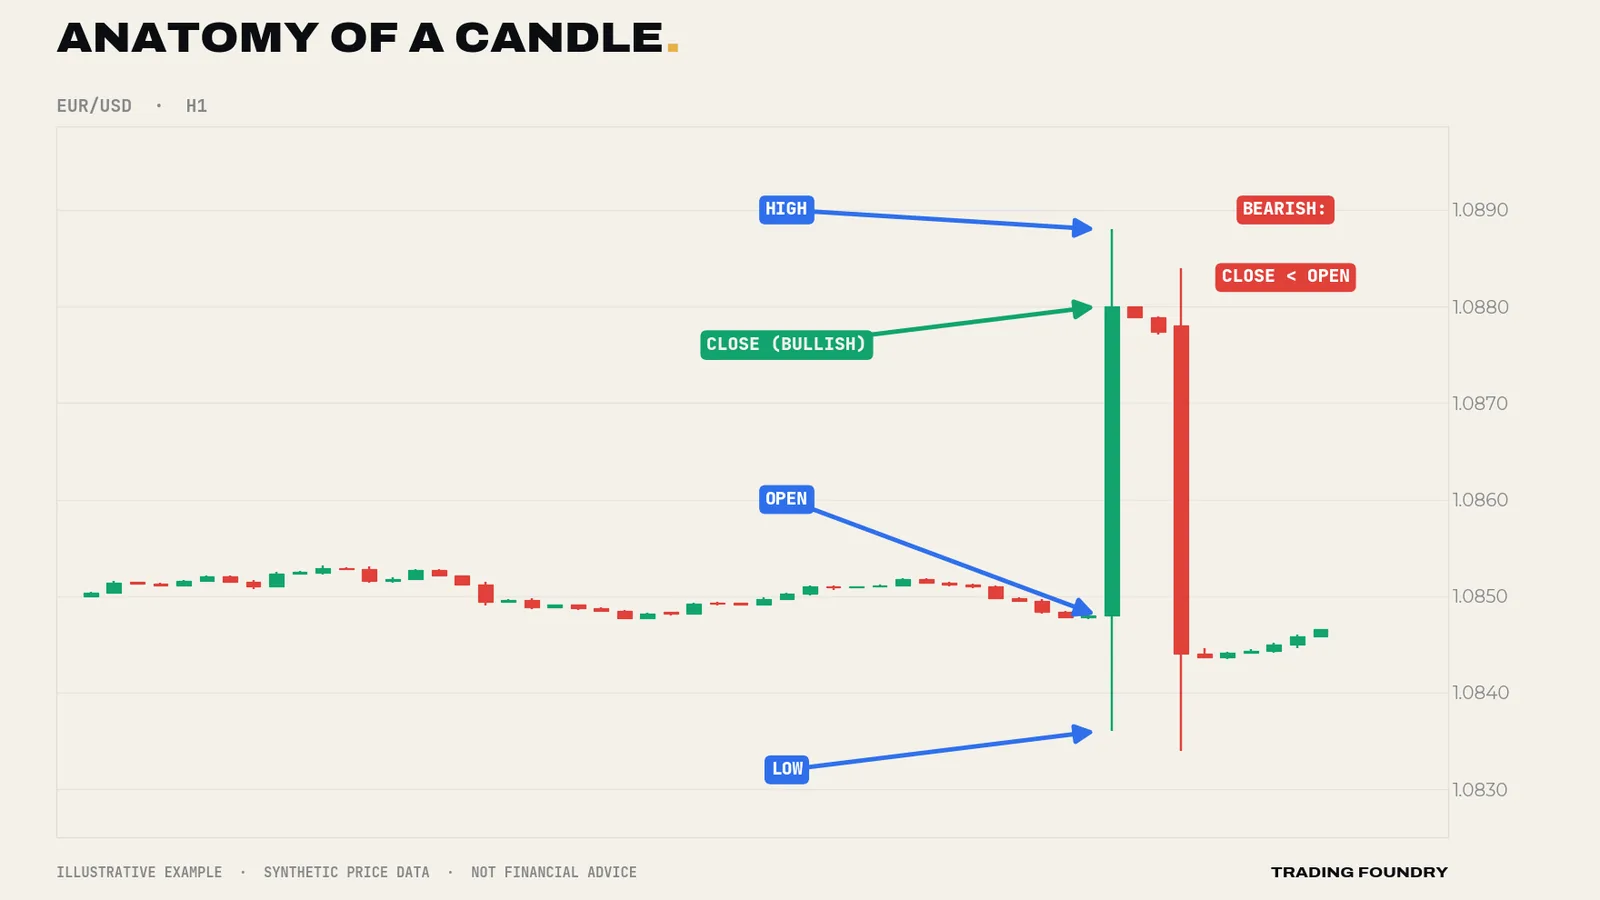
Every candle records four prices for its time period — one hour on an H1 chart, one day on a D1 chart:
- Open — the first price of the period.
- High — the highest price reached.
- Low — the lowest price reached.
- Close — the last price of the period.
The thick part, the body, spans the open and the close. If the close is above the open, the candle is bullish — drawn green here. If the close is below the open, it is bearish — drawn red. The thin lines above and below the body are the wicks (also called shadows). They show how far price travelled beyond the body before being pushed back.
The close is the verdict
Of the four prices, the close matters most. The open is where the argument started and the high and low are where it wandered; the close is where the period ended up — the price everyone holding a position was marked at when the candle finished.
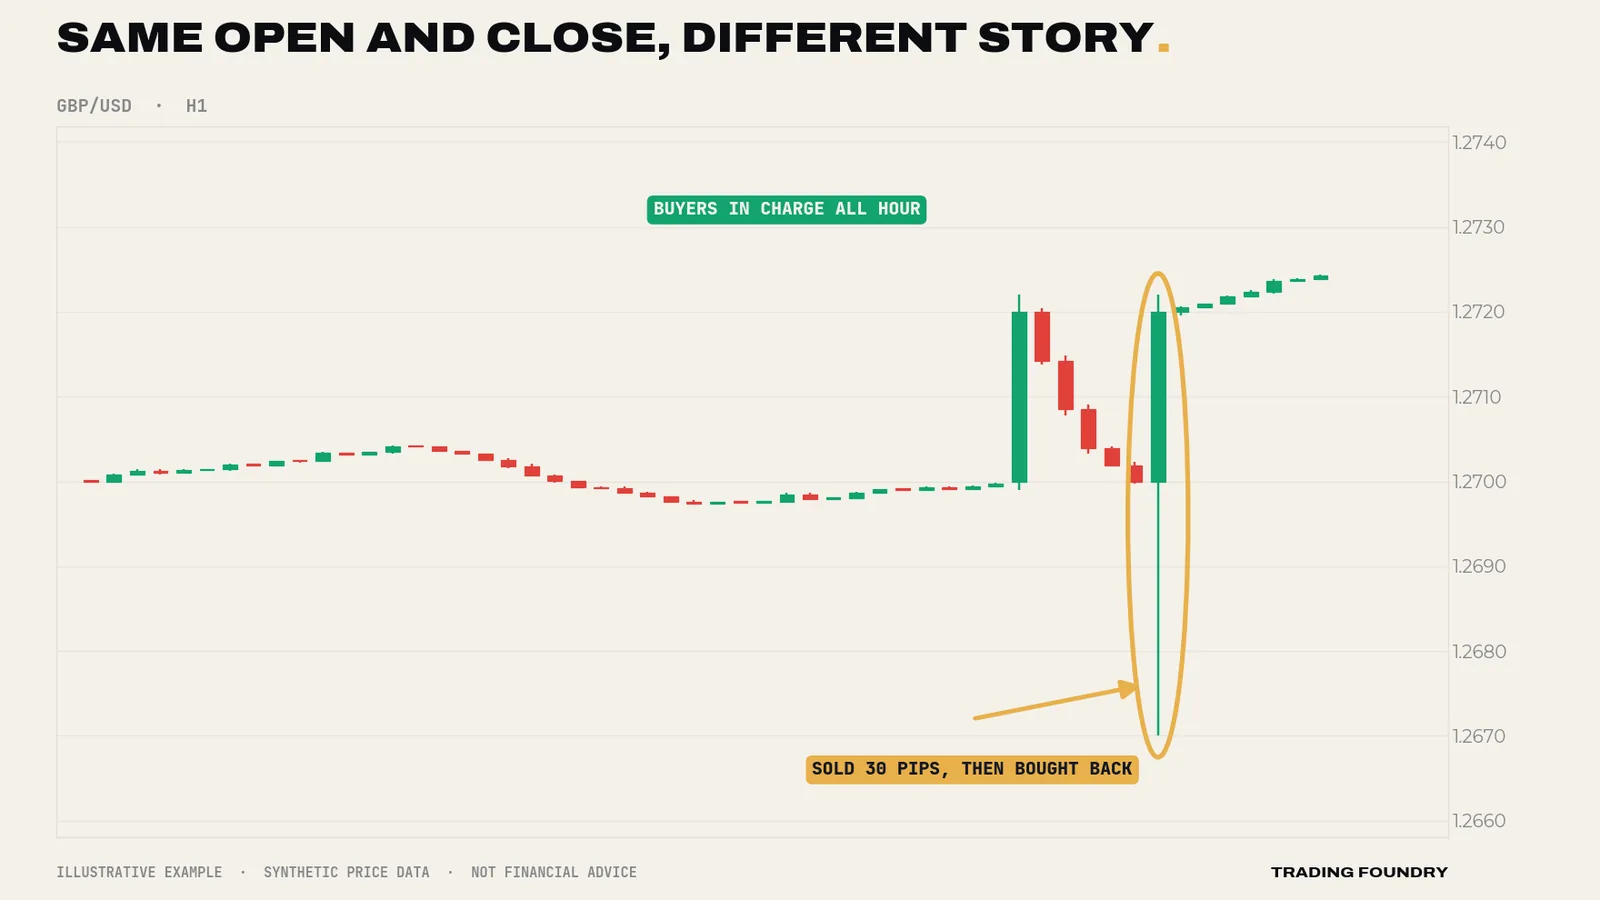
This is why experienced traders wait for candles to close before reading them. Halfway through an hourly candle, GBP/USD might look like a huge bearish bar. By the close it might have recovered to leave a long lower wick — a candle that says nearly the opposite. Reading a candle before it closes is reading a match report at half-time.
One question will do more for your chart reading than any indicator: where did the candle close within its own range?
- A close in the top quarter of the range: buyers finished in control.
- A close mid-range: nobody won.
- A close in the bottom quarter: sellers had the last word.
Three families of candle
There are dozens of named candle patterns. You need three families.
Momentum candles. Large bodies, small wicks, closing near the extreme. One side was in control for the whole period. Several momentum candles in a row in the same direction show a strong, committed move.
Indecision candles. Small bodies with wicks on both sides — the doji and the spinning top. Buyers and sellers fought to a draw. Indecision after a strong move often means the move is pausing; indecision in the middle of a choppy range means nothing much at all.
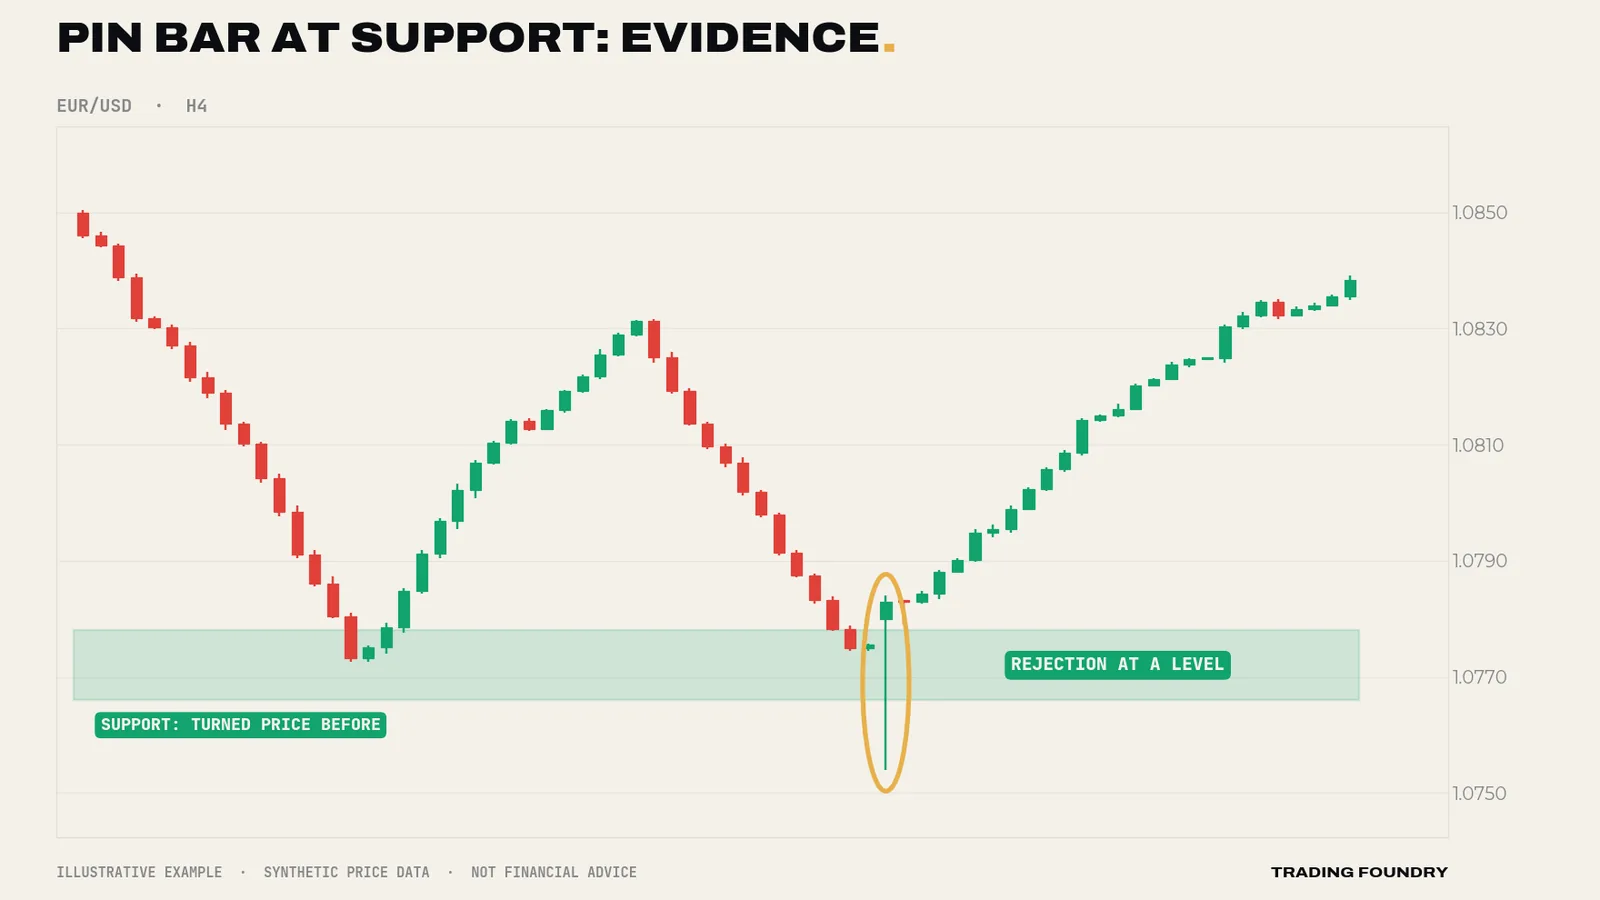
Rejection candles. A long wick on one side, a small body at the other end. The best-known is the pin bar: a wick at least twice the length of the body, with the body near one end of the range. A long lower wick says price was pushed down and then firmly rejected; a long upper wick says the reverse.
Location is everything
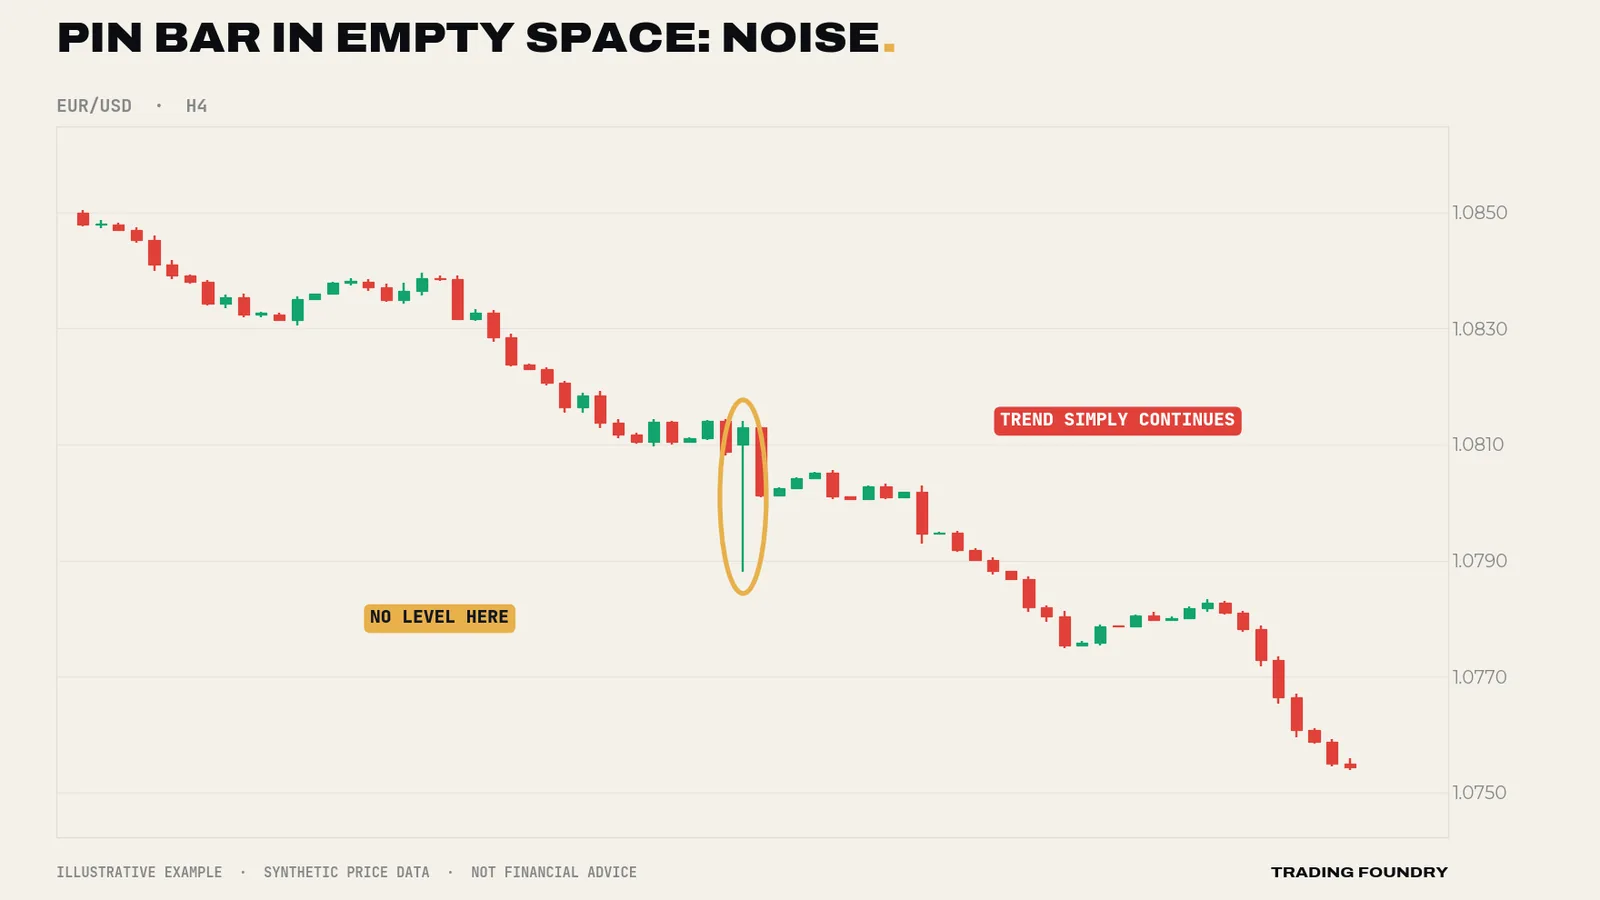
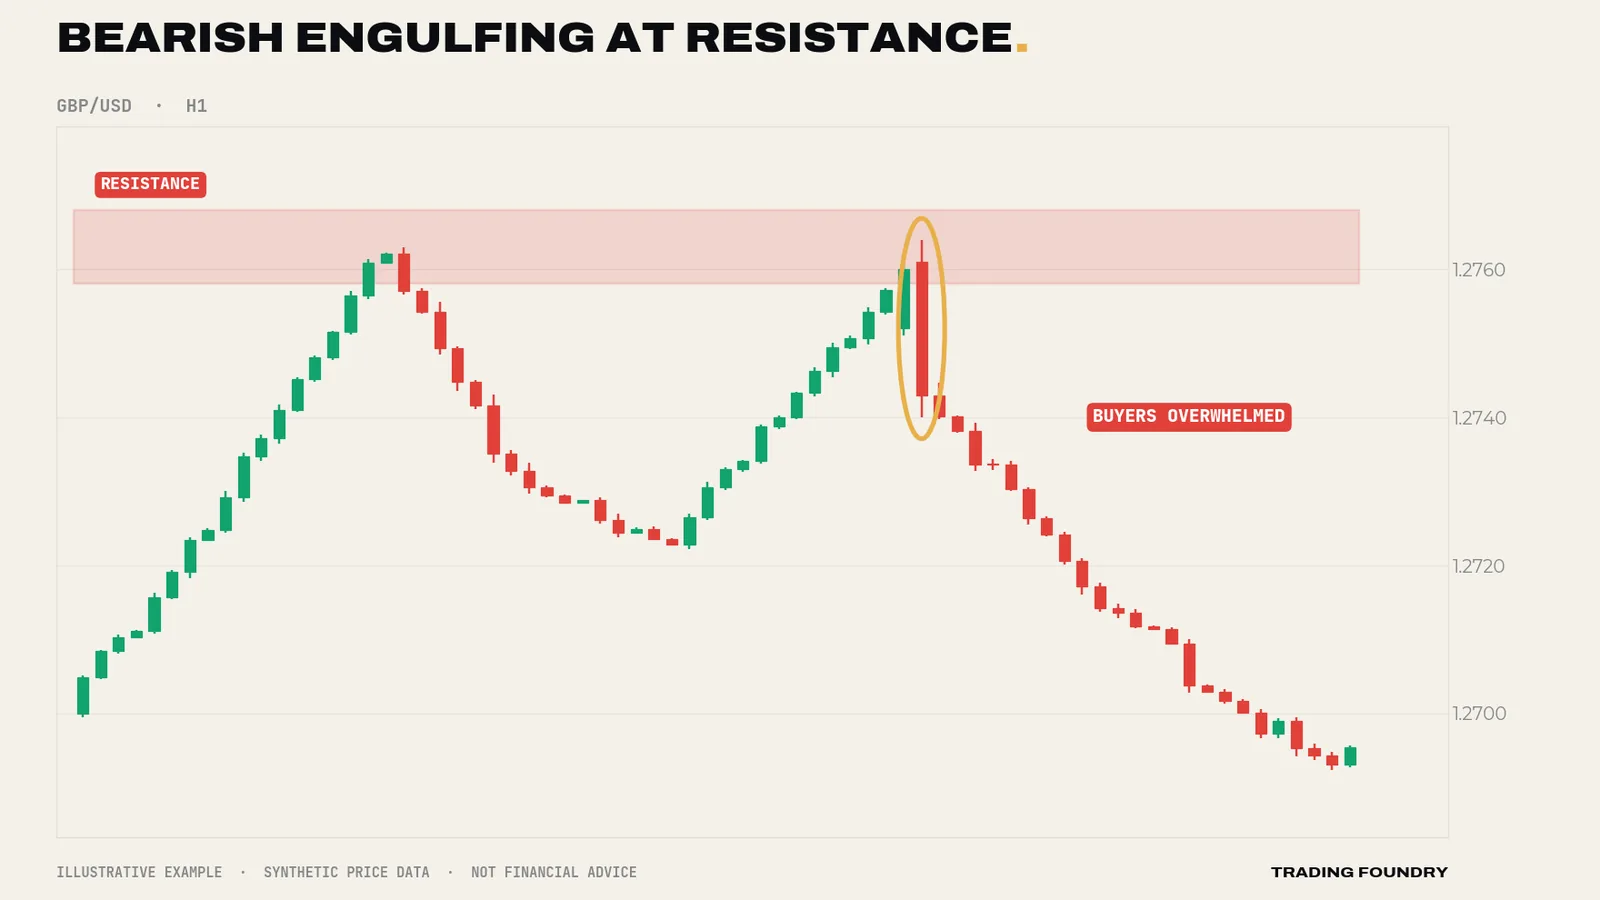
Here is the idea that separates candle reading from candle superstition. A candle pattern only means something at a meaningful price. A pin bar rejecting a level that has turned price several times before is evidence. The same pin bar floating in the middle of nowhere is just a candle with a long wick.
You will learn to mark those meaningful levels — support and resistance — properly in Lesson 9. For now, look at the difference.
Engulfing candles
One two-candle pattern is worth knowing now. A bearish engulfing pattern is a bullish candle followed by a larger bearish candle whose body completely covers the previous body. It shows buyers in apparent control being overwhelmed within a single period. A bullish engulfing is the mirror image. Like the pin bar, it carries far more weight at a level than in the middle of a range.
Reading candles in sequence
Single candles are words; a run of candles is a sentence. Most of the useful information on a chart comes from how candles change from one to the next, not from any one candle on its own.
Three sequences are worth learning to spot.
Expanding bodies. A run of candles in one direction, each with a bigger body than the last, shows the move gathering pace. Buyers (or sellers) are becoming more committed, and the other side is getting out of the way. Fading such a move — trading against it — is usually expensive.
Shrinking bodies. The same run, but with each body smaller than the last and wicks appearing on the side the move is heading towards. The move is still going, but each period gains less ground. This is often the first sign of a pause, especially when it happens as price approaches a level that has turned the market before.
Overlap. Candles whose bodies sit largely on top of each other, alternating colour, show a market going nowhere. Neither side can make progress. Signals inside heavy overlap are unreliable, because the chart has no direction for them to mean anything against.
A practical exercise: take any H1 chart, cover everything to the right of a candle with a piece of paper, and describe the last five candles in a sentence — "bodies getting smaller, wicks appearing above, approaching a previous high". Then slide the paper across one candle at a time. You are not trying to predict. You are training your eye to describe what is in front of it, which is the skill every later lesson depends on.
Going deeper
Every candle contains a chart. A daily candle is a summary of 24 hourly candles. A long lower wick on the daily chart is, on the hourly chart, a visible sell-off followed by a visible rally. The summary filters noise — but two very different days can print identical candles. That is one reason to read candles in sequence and in context rather than one at a time.
Higher timeframes carry more weight. A daily pin bar records the activity of a full day's participants. A one-minute pin bar might be a single order. The shapes look the same; the evidence is not. While you learn, read candles on H1 and above.
Candles are evidence, not prophecy. A rejection candle tells you what happened; it does not guarantee what happens next. Price action trading is the practice of stacking evidence — level, trend, candle, timing — until the odds lean slightly your way, and then limiting the damage when they do not. Even an A-grade pin bar at a strong level can and will fail. That is what stops are for.
Ranges and the body ratio. A useful objective test for momentum is body size as a fraction of the candle's total range. A body over about 70% of the range, closing near the extreme, is a momentum candle. A body under about 25% is indecision or rejection, depending on where the body sits. Measuring this keeps you honest when you "want" to see a pattern.
Summary
- Each candle shows open, high, low and close; the body is the result, the wicks the struggle.
- The close is the verdict. Wait for it, and ask where it sits within the range.
- Three families: momentum (big bodies), indecision (small bodies, two-sided wicks) and rejection (long single wick, such as the pin bar).
- Location decides meaning: patterns at support or resistance are evidence; in empty space they are mostly noise.
- Engulfing candles show one side overwhelming the other; like all patterns, they matter most at a level.
Quick quiz.
Education only, not financial advice. Charts are illustrative training examples using synthetic price data, not real market history or results.