 TRADING FOUNDRY
Timeframes — Why Two Traders See Opposite Things.
Choose a sensible pair of timeframes, read the higher one for direction and the lower one for timing, and avoid the trap of trading against the bigger picture.
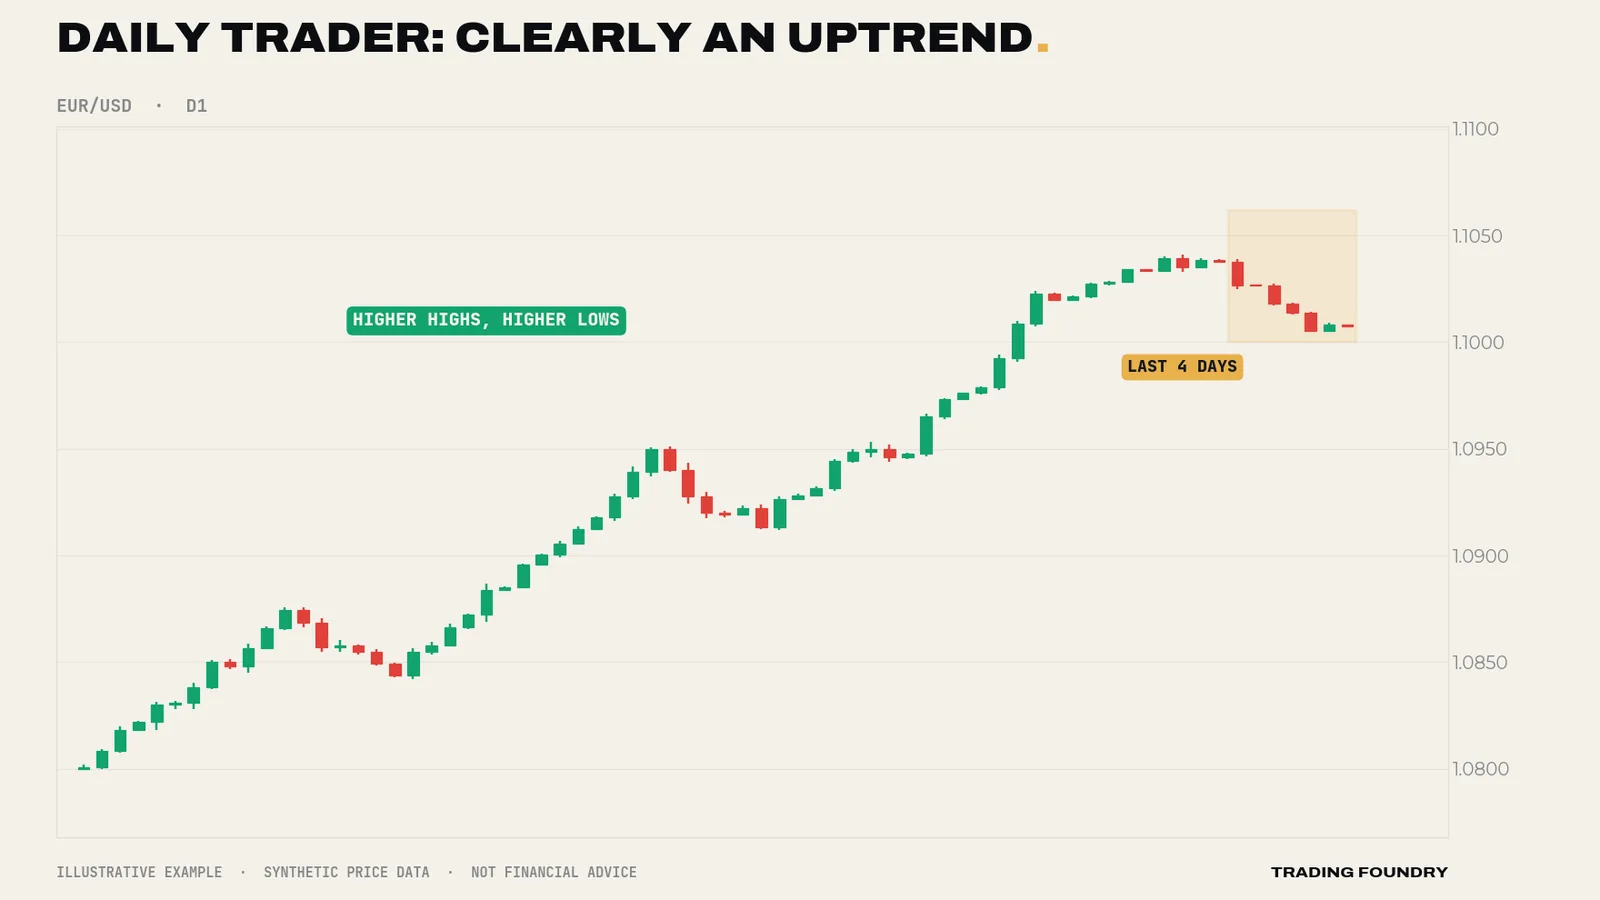
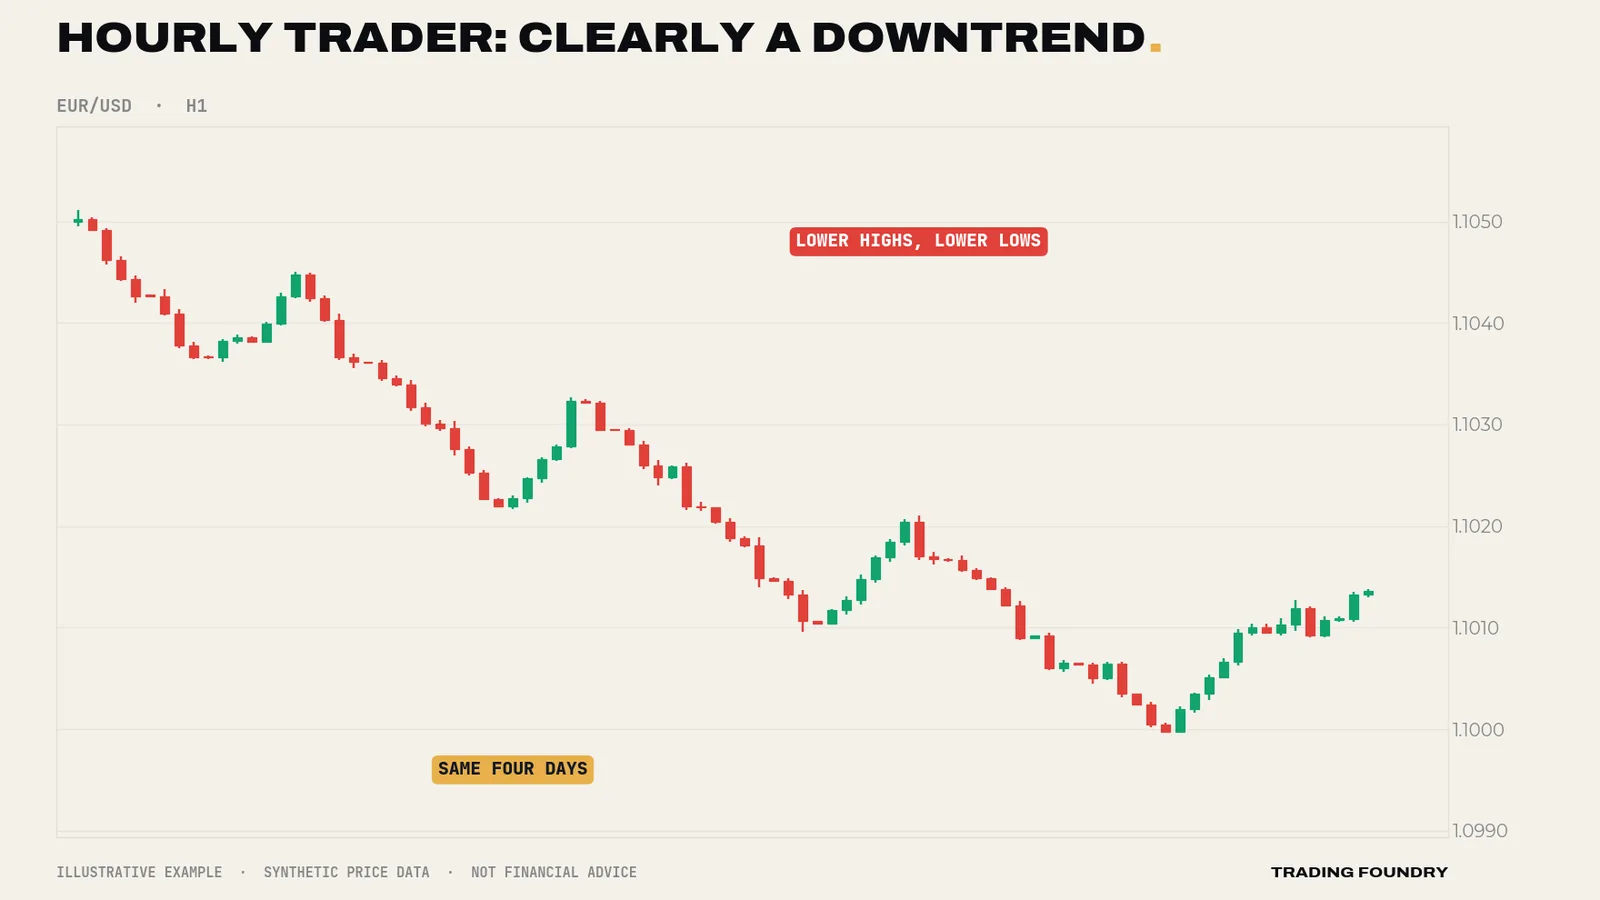
Two traders look at EUR/USD at the same moment. One says it is clearly going up. The other says it is clearly going down. Both are looking at accurate charts from the same broker. Neither is wrong — they are simply looking at different timeframes.
This is one of the most common sources of confusion for new traders, and one of the most expensive. It produces the trader who sees a "downtrend" on the five-minute chart, sells, and is flattened by a daily uptrend they never looked at. It also produces the trader who flicks between six timeframes until one agrees with what they already wanted to do.
This lesson gives you a simple, fixed way to use timeframes: one for direction, one for timing, chosen in advance and never swapped mid-trade. It is the written version of the Trading Foundry film on timeframes.
What a timeframe is
A chart's timeframe is the period each candle covers:
- M1, M5, M15 — one, five and fifteen minutes.
- H1, H4 — one and four hours.
- D1 — one day.
- W1 — one week.
The market underneath is the same. A daily candle is simply the summary of 24 hourly candles; an hourly candle is the summary of 60 one-minute candles. Change the timeframe and you change the zoom, not the market.
But the zoom changes what you see. A strong daily uptrend contains plenty of hourly sell-offs. A neat-looking hourly downtrend may be nothing more than a two-day dip inside that bigger rise.
Higher timeframes carry more weight
Why should the higher timeframe usually win the argument? Because it summarises more trading. A daily trend reflects the decisions of every participant over weeks — including large funds and businesses whose orders take days to fill. A five-minute move might reflect a few large orders and some algorithms reacting to each other.
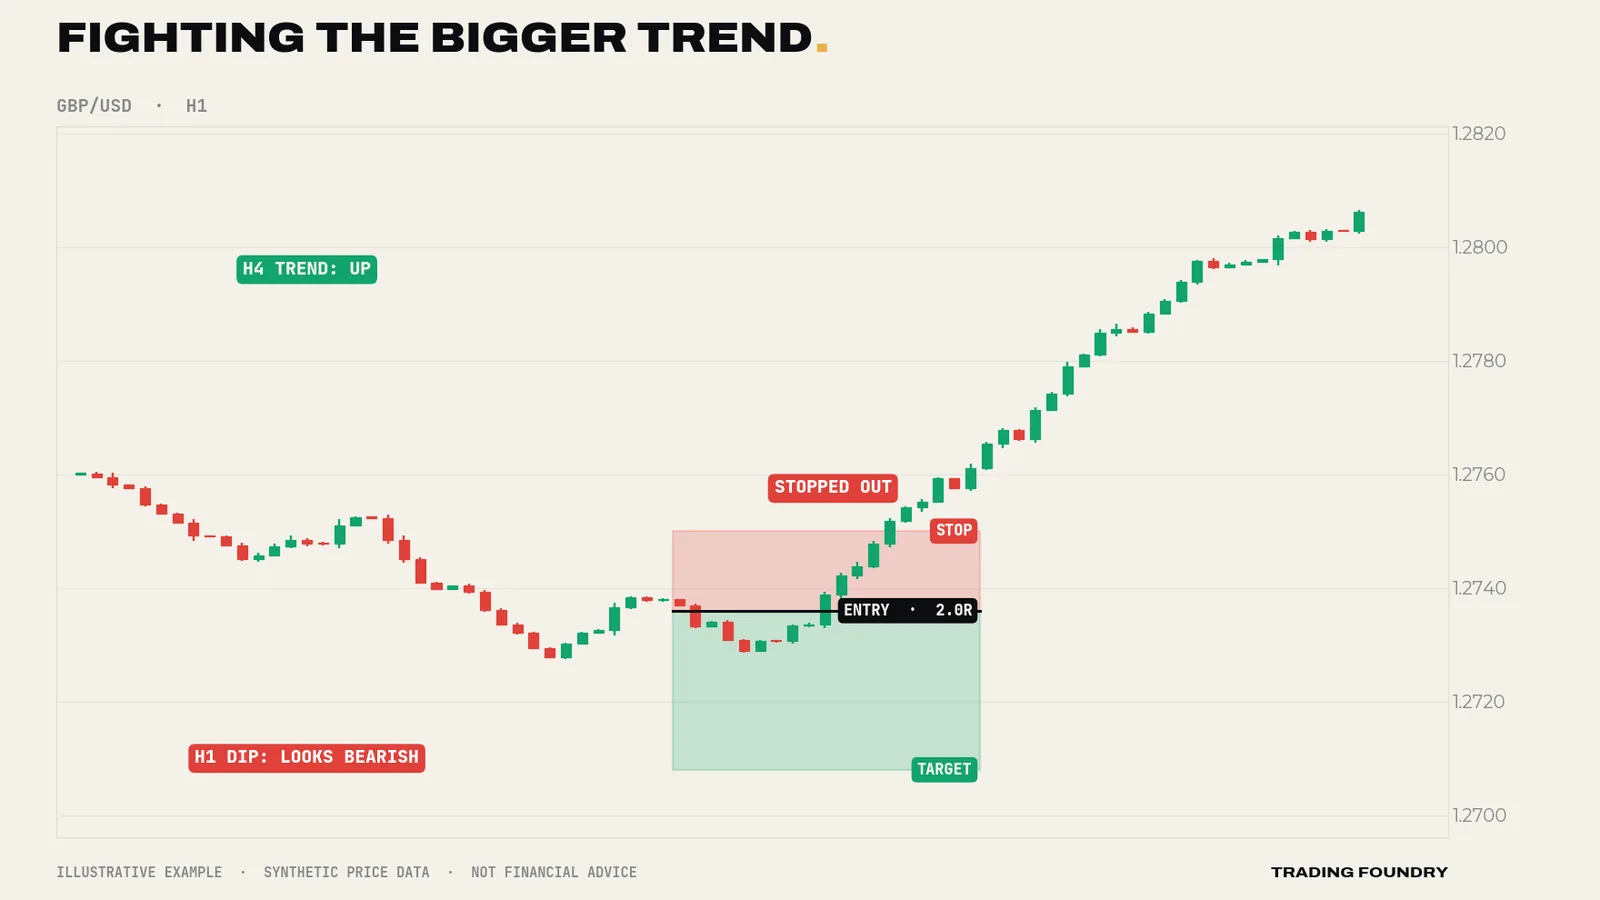
So when the hourly chart says "down" and the daily chart says "up", the most likely story is that you are looking at a dip in a rising market. It might become a reversal. But until the higher timeframe itself shows the trend breaking, the odds favour it continuing.
This leads to a simple discipline: use the higher timeframe for direction and the lower timeframe for timing. If the H4 chart is in an uptrend, you look only for buying opportunities on the H1 chart. If the H4 is in a downtrend, only selling opportunities. If the H4 is going sideways with no clear direction, you probably do nothing.
Pairing your timeframes
A common, workable rule of thumb is to use two timeframes roughly four to six times apart:
| Direction (higher) | Timing (lower) | Typical holding time |
|---|---|---|
| W1 | D1 | Weeks |
| D1 | H4 | Days |
| H4 | H1 | Hours to a couple of days |
| H1 | M15 | Hours |
For beginners, this course recommends H4 for direction and H1 for timing. It is slow enough to think, fast enough to see several opportunities a week, and the stops are wide enough that costs are a small fraction of them (Lesson 3). It also fits around most working lives better than you might expect: an H1 candle gives you an hour to decide.
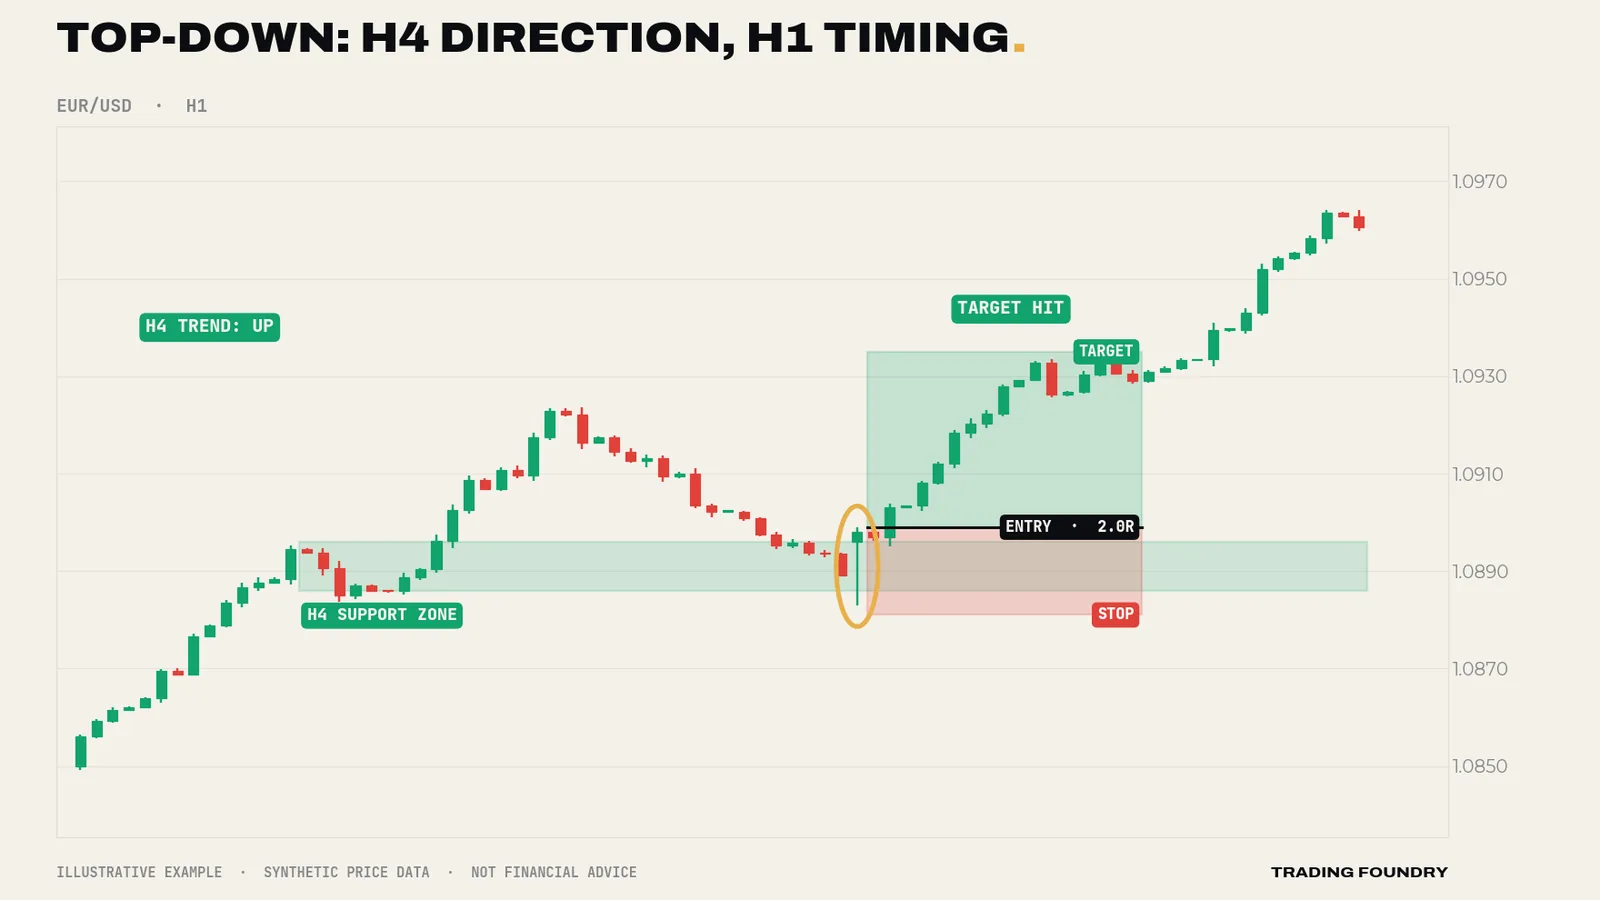
The routine is called top-down analysis:
- On H4, decide the direction: uptrend, downtrend or no trend (Lesson 8).
- On H4, mark the key support and resistance zones (Lesson 9).
- Drop to H1 and wait for price to reach one of those zones in line with the H4 direction.
- Use an H1 candle signal at that zone as the trigger, with a stop beyond the zone.
Why beginners should avoid the smallest timeframes
The one-minute and five-minute charts look exciting. Things happen constantly. That is precisely the problem.
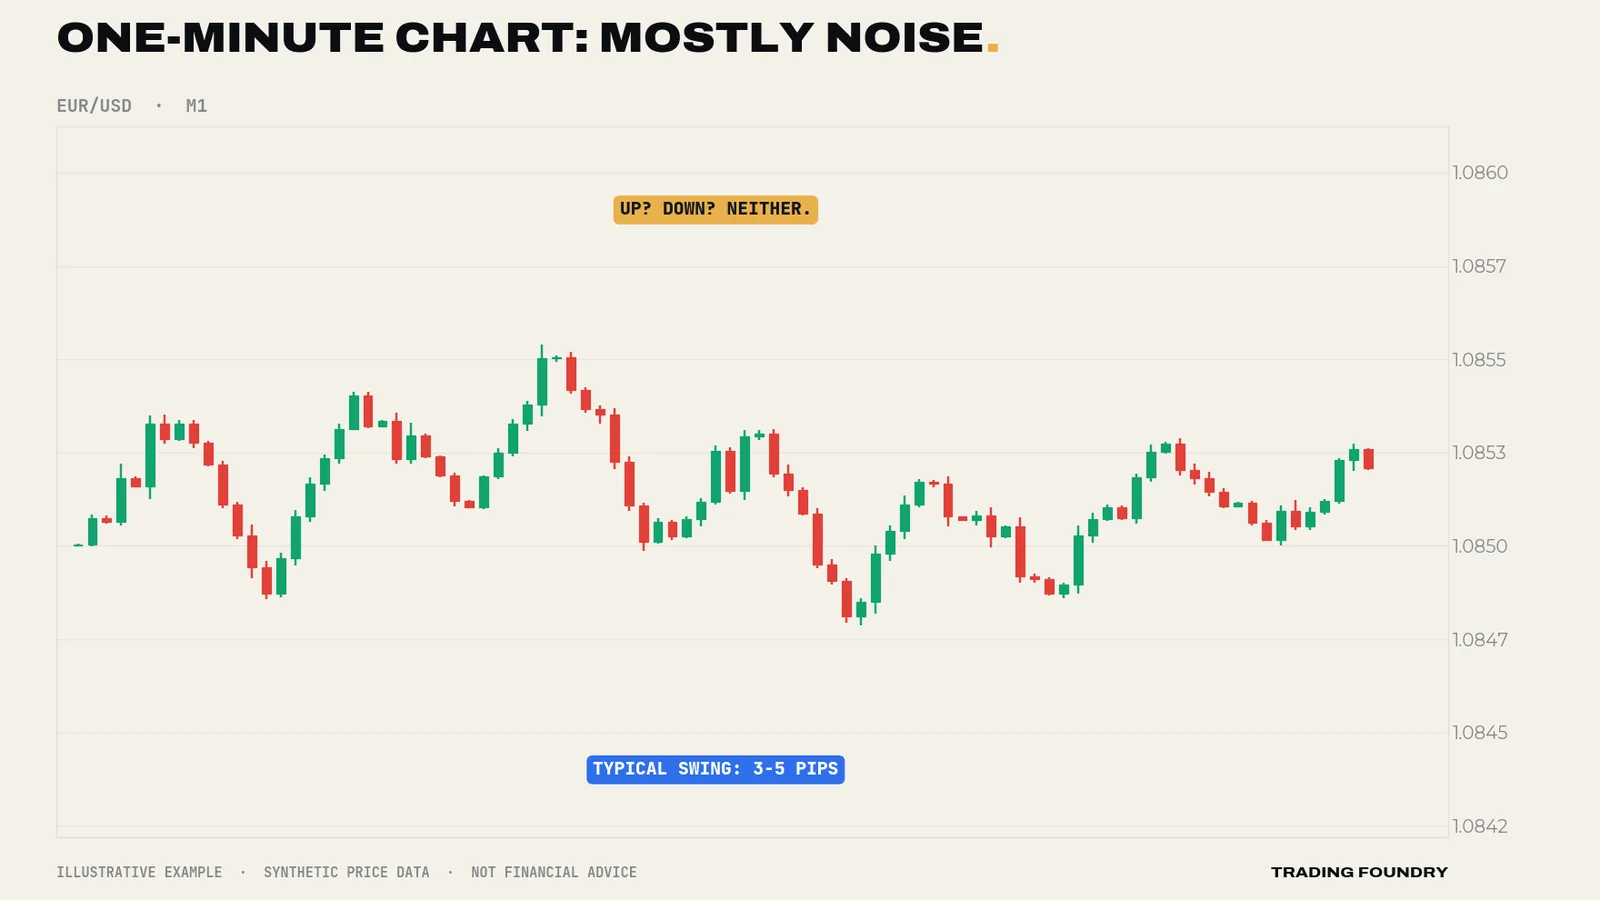
On M1 and M5 charts:
- The swings are small, so costs are a large share of every stop and target.
- Noise dominates. Random wiggles are hard to tell from real moves.
- Decisions have to be made in seconds, which favours emotion over thought.
- You can take dozens of trades a day, which multiplies every mistake.
None of this makes short-term trading impossible — the Trading Foundry scalping course exists for those who want to learn it properly. It simply means it is the wrong place to learn.
A top-down routine in words
Here is what the routine sounds like in practice, on an illustrative Tuesday morning.
"On H4, EUR/USD has made three higher highs and three higher lows over the past two weeks. That is an uptrend, so today I am only interested in buying. The last swing high, broken yesterday, is at about 1.0900, and that area — 1.0892 to 1.0904 — is the nearest support zone below price. Price is currently 35 pips above it. Nothing to do yet."
Two hours later: "Price has pulled back into the zone. I switch to H1. The last H1 candle closed with a long lower wick and a body near its high, inside the zone. That is a rejection candle in the direction of the H4 trend, at an H4 level. Now I can plan a trade: entry above the candle's high, stop below the zone and the wick, target at least twice the risk and short of the next resistance."
Notice what did not happen. The trader did not look at the H1 chart until H4 had pointed somewhere. They did not take a trade because H1 looked exciting at 07:00. They did not check M5 to fine-tune anything. The higher timeframe made two decisions — direction and location — and the lower timeframe made one: timing. Keeping those jobs separate is most of the skill.
Going deeper
Fractal, but not identical. Markets look broadly similar at every zoom level — trends, pullbacks and ranges at every scale. But they are not identical. Lower timeframes have proportionally more noise and higher costs relative to the moves; higher timeframes have bigger stops, fewer trades and more exposure to overnight and weekend gaps. Pick the scale whose trade-offs suit your account, costs and time.
Alignment in three layers. Some traders add a third, higher timeframe for context — for example D1 for the big picture, H4 for direction and H1 for timing. When all three agree, the conditions are strongest. When the D1 is heading into a major resistance level, even a clean H4 uptrend deserves caution, because the bigger picture may be about to push back.
Candle times and your broker's clock. H4 and D1 candles open and close at times set by your broker's server clock. A broker on New York close time produces five daily candles a week; one on UK time may produce a small sixth candle on Sunday evening. This changes how daily candles look, so be aware which you are using if you compare charts.
Holding time follows timeframe. A trade entered on H1 with a stop based on H1 structure will usually take hours to a day or two to resolve. If you cannot leave a position open overnight, H1 entries late in the London afternoon may not suit you. Plan your timeframe around your actual availability.
- Choose two timeframes before looking at the market: H4 for direction, H1 for timing in this course
- Only trade in the direction of the higher timeframe's trend; if it has no clear direction, stand aside
- Manage a trade on the timeframe you entered it on — no switching down to "check"
- No M1 or M5 trading while learning
Summary
- A timeframe is the period each candle covers; changing it changes the zoom, not the market.
- Different timeframes can show opposite directions at the same moment, and both are accurate.
- Higher timeframes summarise more trading and usually win the argument: use them for direction.
- Use the lower timeframe for timing. This course uses H4 for direction and H1 for timing.
- The smallest timeframes are dominated by noise and costs — the wrong place to learn.
Quick quiz.
Education only, not financial advice. Charts are illustrative training examples using synthetic price data, not real market history or results.