 TRADING FOUNDRY
Trend or Range? Reading Market Structure.
Identify uptrends, downtrends and ranges from swing highs and lows, spot when a trend is breaking, and decide which conditions are worth trading at all.
Before you ask "should I buy or sell?", there is a more important question: what kind of market is this? A market that is trending behaves very differently from one that is going sideways, and an approach that works well in one tends to lose steadily in the other. Most beginners never ask the question. They use the same idea everywhere and are baffled when it works for a month and then stops.
This lesson teaches you to read market structure — the pattern of swing highs and swing lows — so you can label any chart as an uptrend, a downtrend or a range, quickly and objectively. It is the foundation for the H4 "direction" step in the top-down routine from Lesson 7.
Swing highs and swing lows
Price never moves in straight lines. It moves in waves: a push, a pause or pullback, another push. The turning points of those waves are swings.
- A swing high is a peak: a candle with lower highs on either side of it.
- A swing low is a trough: a candle with higher lows on either side of it.
On any chart there are tiny swings everywhere. For reading structure, you want the obvious ones — the peaks and troughs you would point to if someone asked "where did price turn?". On H4, those are typically 30 to 100 pips apart on the major pairs. If you have to squint, it is not a swing.
The uptrend
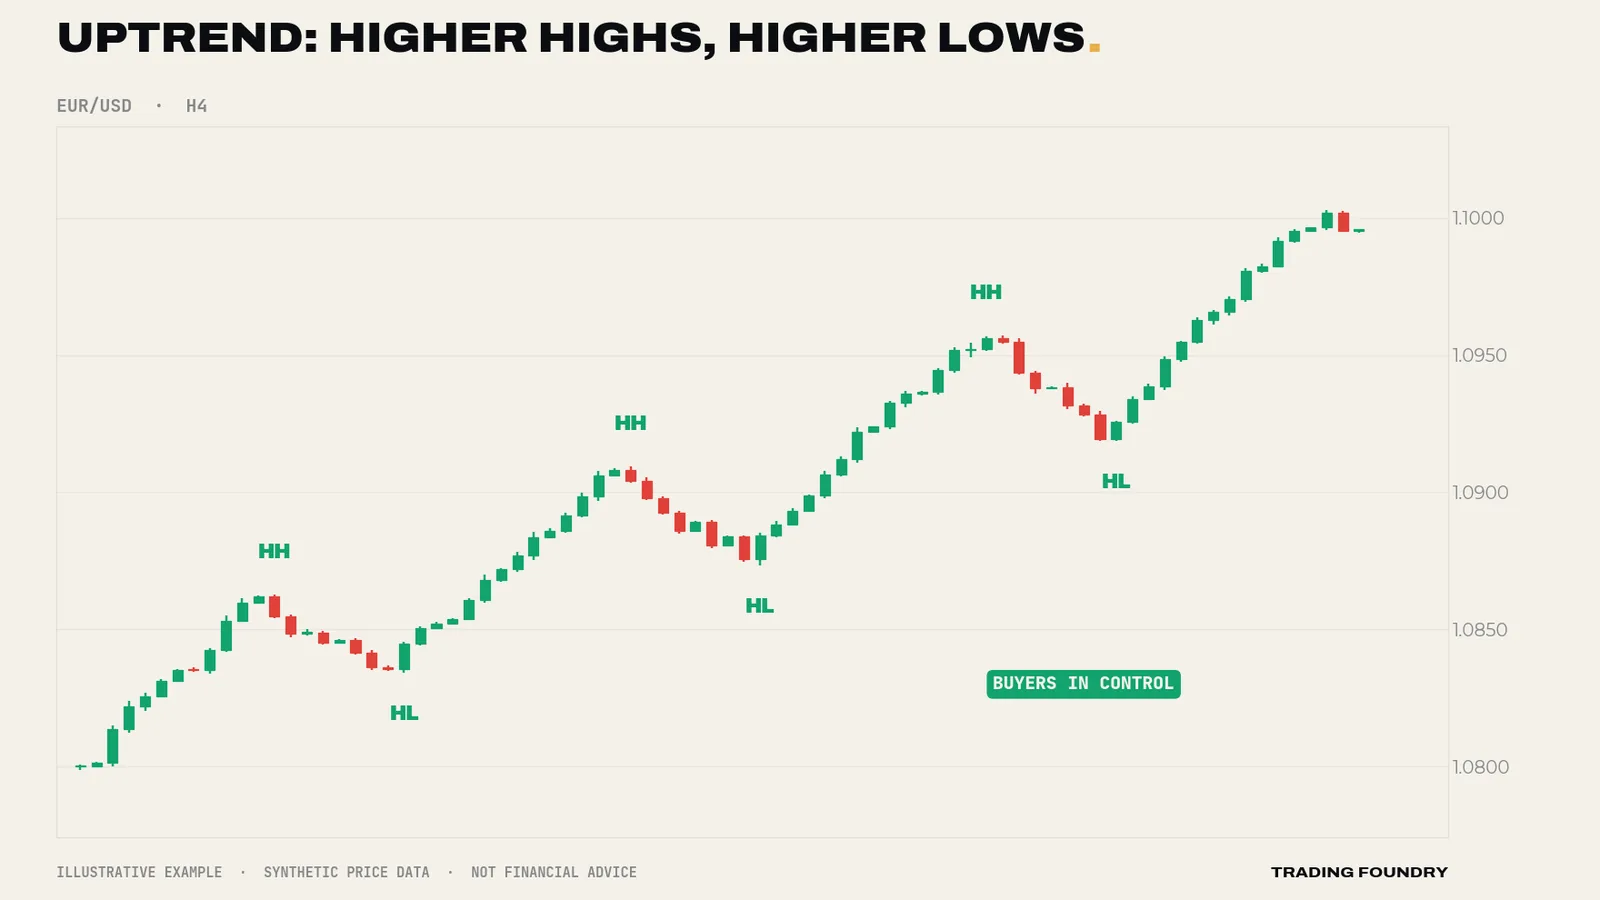
An uptrend is a sequence of higher highs (HH) and higher lows (HL). Each push up goes further than the last, and each pullback stops above the previous pullback's low. Buyers are in control: they are willing to pay more on each wave, and they step in sooner on each dip.
The downtrend
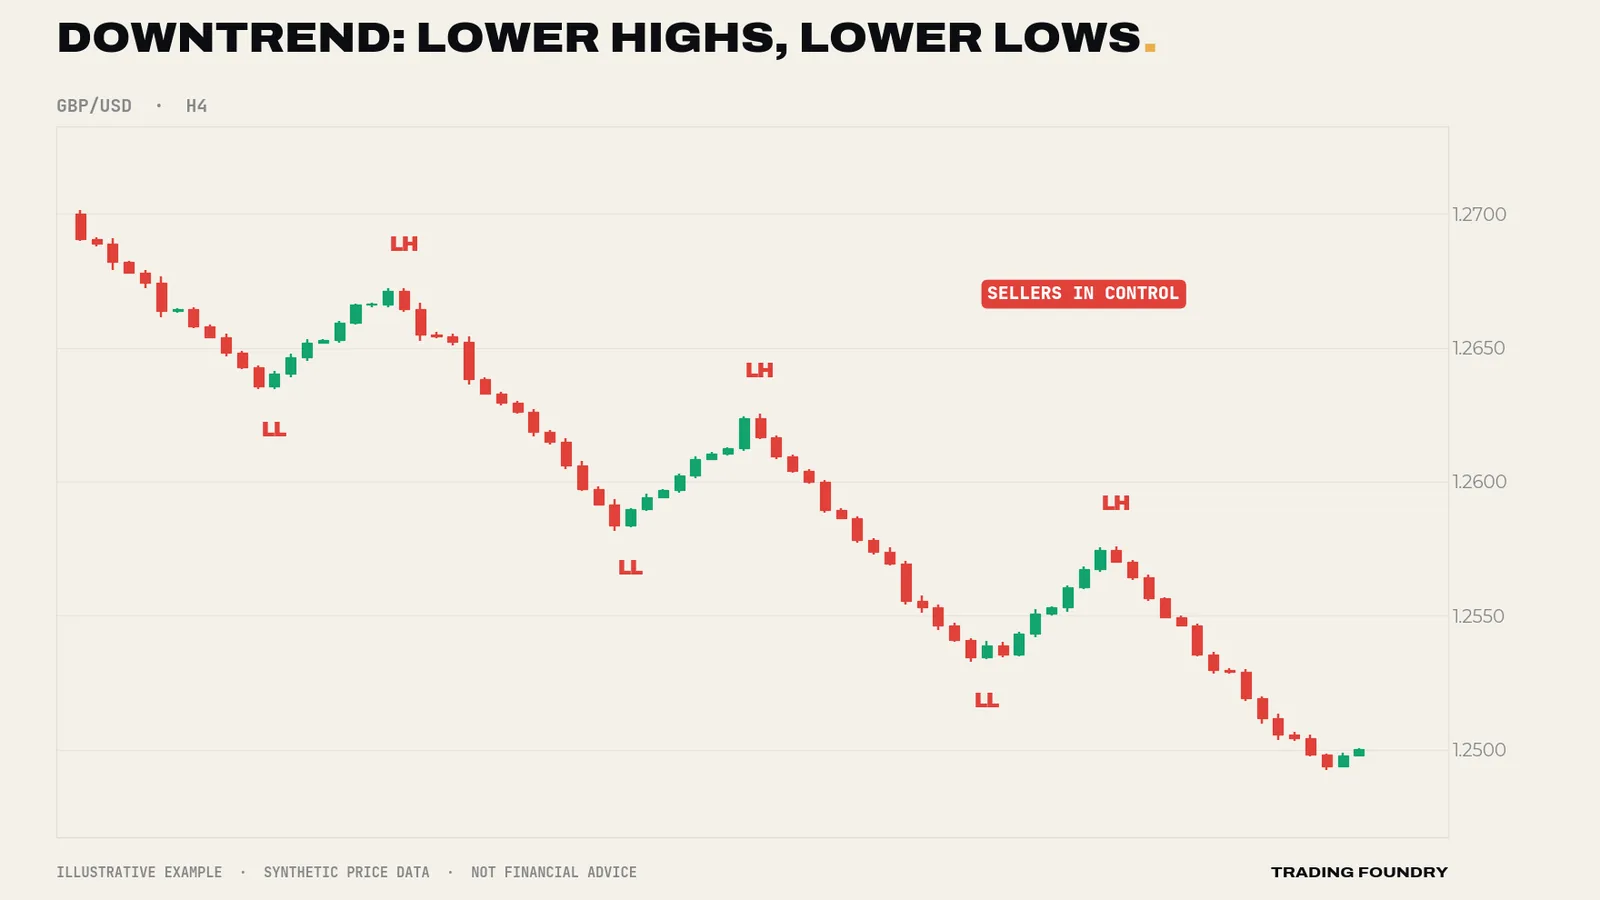
A downtrend is the mirror image: lower highs (LH) and lower lows (LL). Each rally fails below the previous one and each sell-off breaks to a new low. Sellers are in control.
The range
A range is a market moving sideways between a reasonably clear ceiling and floor. Highs are roughly equal; lows are roughly equal. Neither side is in control for long. Markets spend a great deal of their time in ranges — often more than in trends.
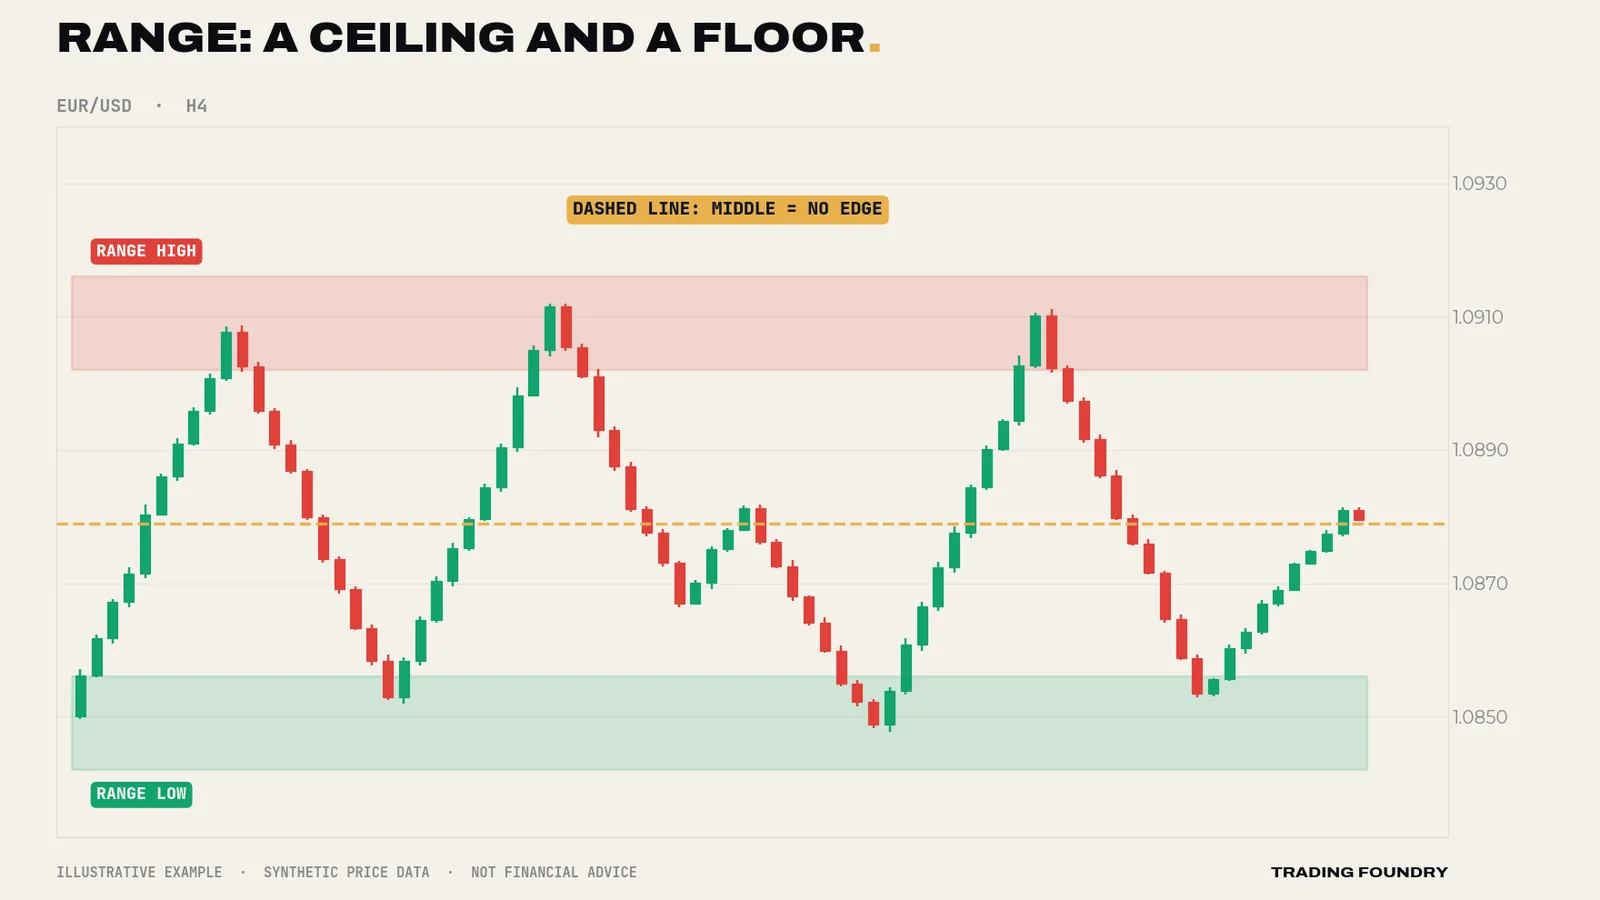
In a range, the edges carry information and the middle carries very little. Buying in the middle has the ceiling as an obstacle a few dozen pips away and the floor as a stop a few dozen pips the other way — a poor trade-off either direction. For beginners, the simplest approach is: trade trends, and treat ranges as a reason to wait. Range-trading strategies exist and can be learned later, but they need their own rules.
When a trend ends
Trends do not last for ever. The structure itself usually gives the first warning.
In an uptrend, watch for two things:
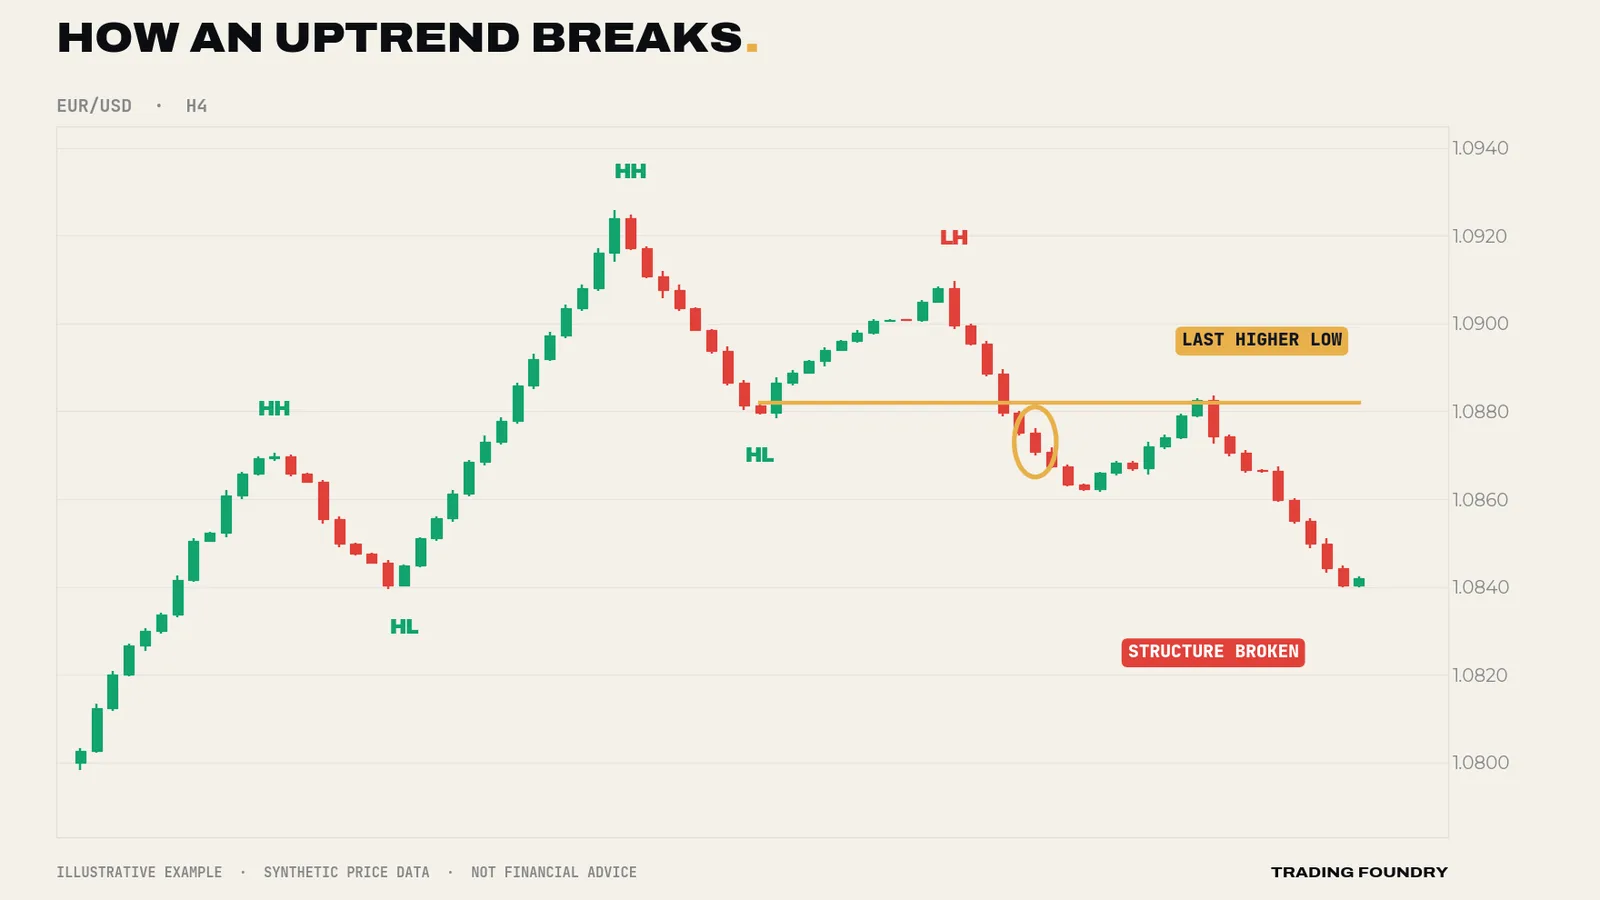
- A failure to make a higher high. Price rallies but stalls below the previous peak. That is a lower high — the first crack.
- A break of the last higher low. Price falls below the most recent pullback low. Now the sequence of higher lows is broken too.
When both have happened, the uptrend is over as far as structure is concerned. That does not mean a downtrend has started — it may become a range — but it does mean you stop looking for buys.
Practice drill: trend or not?
Here is a chart to read before you look at the answer. Label the structure, then decide: is this a market where a beginner using this course's approach should be looking for a trade?
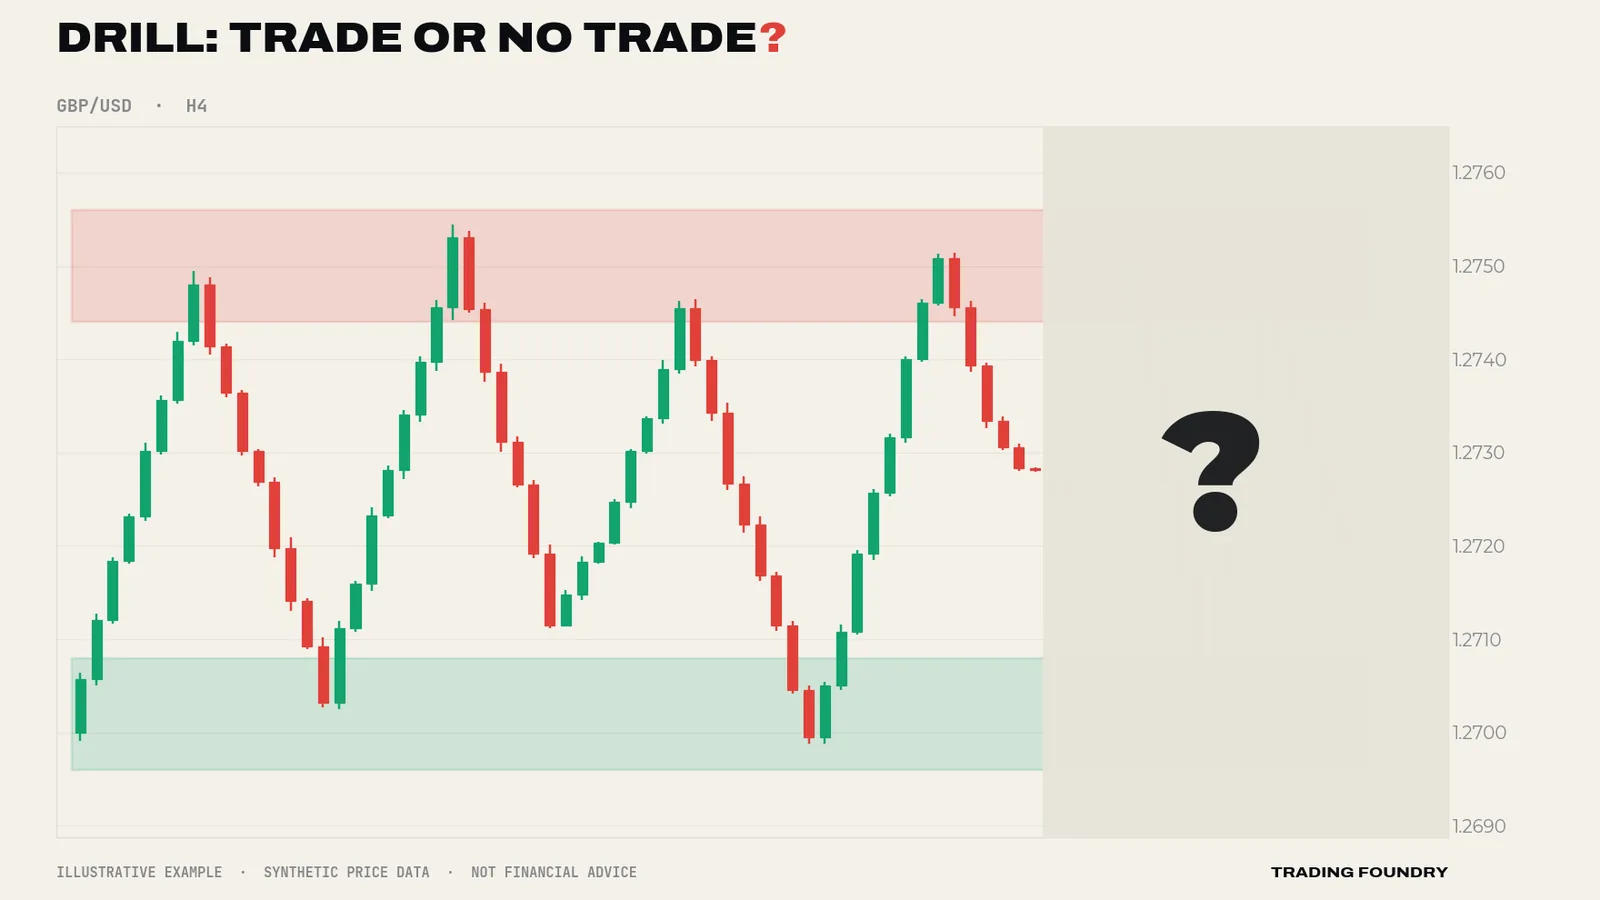
No trade. Look at the swings: the highs are roughly equal near the top zone and the lows are roughly equal near the bottom zone — no higher highs, no lower lows. This is a range, and price is sitting in the middle of it, the least informative place on the chart. After the reveal, price keeps bouncing between the edges. A trend trader has no direction to follow here; the right decision is to wait for structure to change.
Labelling structure, step by step
When you first try this, it can feel subjective. A simple, repeatable procedure helps.
- Open H4 with about two months of history. Remove indicators so you can see the swings.
- Mark the five or six most obvious turning points, working from left to right. Only mark swings where price clearly changed direction and travelled a meaningful distance afterwards — not every two-candle wobble.
- Compare each high with the previous high, and each low with the previous low. Write HH, LH, HL or LL next to each.
- Read the most recent three or four labels. HH and HL together: uptrend. LH and LL together: downtrend. A mixture, or roughly equal levels: range or transition.
- Write the verdict down — "H4: uptrend", "H4: downtrend" or "H4: no trend" — before you look at any other chart.
That last step matters more than it looks. If you write "no trend" and then catch yourself hunting for a buy on H1 an hour later, you have caught yourself breaking your own plan. Without the written verdict, you would never notice.
Ranges inside trends, trends inside ranges
Structure exists on every timeframe at once, which is why Lesson 7 insists on one timeframe for direction. A healthy H4 uptrend often contains short H1 ranges — pauses where the market digests a move before the next push. Equally, a wide D1 range can contain perfectly tradeable H4 trends running from one side of it to the other.
This is not a contradiction. It simply means your label is always "an uptrend on H4" or "a range on H4". When the direction timeframe is trending, a small range on the timing timeframe is just a pause. When the direction timeframe is ranging, a neat trend on the timing timeframe is just a trip from one side of the box to the other, and it will probably stop at the far edge.
Going deeper
Choosing which swings count. Structure depends on which swings you treat as significant, and that is where subjectivity creeps in. Two practical aids: first, judge swings on your direction timeframe (H4 here), not on the timing timeframe. Second, a swing only "counts" if the move away from it was meaningful — for example, at least a third of the average daily range. Write your own definition down and apply it consistently; consistency matters more than which definition you pick.
Trend strength. Not all trends are equal. Strong trends have deep pushes and shallow pullbacks — a pullback that retraces only a third of the previous push. Weakening trends have shallower pushes and deeper pullbacks, often retracing more than two-thirds. Watching the ratio of push to pullback gives an early, objective clue that a trend is tiring before the structure actually breaks.
Moving averages as a helper. A moving average such as the 50-period EMA can help you see the trend at a glance: price mostly above a rising average in an uptrend, mostly below a falling one in a downtrend, and crossing back and forth through a flat average in a range. It is a summary of structure, not a replacement for reading it. The Trading Foundry trend courses go into this properly.
Regimes change. A market can trend for months and then range for months. Strategies that rely on trends tend to give back profit in ranges, and vice versa. Labelling the regime first, and having a rule for "no trade" conditions, is one of the simplest ways to avoid giving back what a good trend gave you.
- Label the H4 structure before every trade: uptrend (HH + HL), downtrend (LH + LL), or range
- Only look for buys in an H4 uptrend and sells in an H4 downtrend
- A trend is over when it fails to make a new extreme and breaks its last pullback swing
- In a range, or in the middle of one, stand aside
Summary
- Structure is the pattern of swing highs and lows on your direction timeframe.
- Uptrend: higher highs and higher lows. Downtrend: lower highs and lower lows. Range: roughly equal highs and lows.
- In a range, the edges hold the information; the middle has none.
- A trend ends when it fails to make a new extreme and then breaks its last pullback swing.
- For beginners: trade trends, and treat ranges as a reason to wait.
Quick quiz.
Education only, not financial advice. Charts are illustrative training examples using synthetic price data, not real market history or results.